4 Technical Quality: Other
4.1 Reliability
Test reliability can be viewed through several lenses, all of which document how consistently an assessment performs across occasions, contexts, and raters. Typical strategies for addressing reliability include documentation of internal consistency, split-half reliability, and test-retest reliability. If multiple forms are implemented, test form reliability documentation is also requisite. The implementation plan for the ORExt includes initial documentation of internal consistency (Cronbach’s alpha). The 2015-16 technical report included internal consistency estimates, split-half reliability analyses, as well as a small test-retest assessment of reliability comparisons by means of the pilot tablet administration study. There is only one test form for the ORExt, so test form comparisons are not possible.
4.1.1 Inter-Rater-Reliability
4.1.1.1 Background
Pursuant to Hallgren (2012) the assessment of IRR may be necessary to demonstrate consistency among observational ratings provided by multiple assessors. The results of the study will be used to address the requirements within the USED’s Peer Review process (Critical Element 4.1). A sample of Oregon’s Qualified Assessors (QAs) who administer the paper/pencil version of the Oregon Extended Assessment (ORExt) were observed to determine reliability of administration and scoring. A tablet administration was not included in the Oregon Observational Rating.
4.1.1.2 Methods
QTs in districts across the state observe a sample of their respective QAs using the observation protocol (see Oregon Extended Assessment Technical Report on Standard Setting) and enter their data online. The QA reads the item stem and the student selects from three possible answer choices (A, B, or C) then, the QA records the answer choice. QTs (observer) records the students answer choice, then records the answer choice recorded by the QA for agreement. Only the English Language Arts Writing porting of the ORExt requires additional analysis by the assessor to determine if the written response (answer) meets (1) or doesn’t meet (0) provided critera. Districts from across the state of Oregon participated in the study, matching the state’s student population demographics, including large, medium, and small districts, across all regions. The observation protocol was completed for the identified QA, but the student(s) and content area(s) observed were selected by the QT or QA. BRT researchers contacted district-level QTs at the beginning of the test window, which runs from February 15 - April 26, 2018, to arrange observations that could hopefully be completed within one school day. In addition to addressing inter-rater reliability, the study also evaluated test administration procedures. The methods, results, and interpretation are provided here, in addition to recommended next steps. The observation was composed of three sections:
First, QT’s reviewed ORExt paper/pencil test preparation and administration using the rubric (see Oregon Extended Assessment Technical Report on Standard Setting). Test preparation/administration domains were rated on a four-point scale from Inappropriate (I) to Exemplary (E):
Inappropriate (I) denotes a level of concern that could clearly affect the accuracy of the test results gathered from the test administration. Ratings at this level require substantive retraining of the QA involved.
Somewhat Appropriate (SA) rating denotes a level that includes some minor aspects that could be improved, but the accuracy of the test results are likely not compromised.
Appropriate (A) denotes a level that is consistent with all test administration requirements.
Exemplary (E) level performance suggests that the QA incorporated approaches to test administration that could become models for best practice.
Second, QT’s scored the student alongside the QA using the scoring sheet. QT’s compared results after this observation to ensure that the QA entered accurate data.
Finally, QT’s observed the QA completing the data entry process to ensure that no errors are made during data entry and document the number of errors (see Oregon Extended Assessment Technical Report on Standard Setting).
4.1.1.3 Domain Definitions
Test Security – The QA utilized a system to ensure that all test materials were stored in a secure location,. The QA also had a district Assurance of Test Security form on file.
Printed Materials – the QA had all materials required to administer the ORExt ready for test administration.
Distraction-Free Environment – the QA arranged to provide the ORExt in a one-on-one test administration in a location that ensured that the student focused attention on the assessment.
Accessibility Supports – the QA provided all necessary accessibility supports for the student and ensured that all support systems were functional prior to testing.
Level of Support – The QA provided an appropriate level of support throughout testing that did not compromise the validity of the score.
Praise – The QA utilized praise appropriately to support student involvement without leading the student to the correct answer.
Motivation – The QA appropriately maintained the student’s motivation during the assessment using relevant strategies, such as token systems.
Score Interpretation – The QA demonstrated an appropriate understanding of how to use the cut scores and achievement level descriptors to interpret scores (i.e., ask the QA to describe how they interpret scores for parents).
Minimum Participation Rule - The QA demonstrated an appropriate understanding of the minimum participation rule (i.e., ask the QA to define the rule if it is not used).
Qualified Assessor Testing Preparation and Administration Rubric - Participants are told to record an “X” in the cell that corresponds to their rating. An example of a filled out form is shown below (example made by most common response by item).
| Domain | Exemplary | Appropriate | Somewhat Appropriate | Inappropriate |
|---|---|---|---|---|
| Accessibility Supports | X | |||
| Distraction Free | X | |||
| Level Support | X | |||
| Minimum Participation | X | |||
| Motivation | X | |||
| Praise | X | |||
| Printed Materials | X | |||
| Score Interpretation | X | |||
| Test Security | X |
4.1.1.4 Inter-rater Agreement Results
Qualified Trainers (n = 25) from around Oregon participated in the Inter-Rater-Reliability study by doing at least one observation on the Oregon Extended Assessment via paper/pencil administration. Not all subjects were equally represented ELA (40%), Math (40%), Science (20%). Observations were done at individual student’s typical testing location.
The following two tables display the percentage of responses in the nine different domains and percentage of agreement between assessors and observers.
| Domain | Exemplary | Appropriate | Somewhat Appropriate | Inappropriate |
|---|---|---|---|---|
| Accessibility Supports | 40% | 56% | 4% | 0% |
| Distraction Free | 28% | 72% | 0% | 0% |
| Level Support | 52% | 48% | 0% | 0% |
| Minimum Participation | 48% | 48% | 4% | 0% |
| Motivation | 44% | 56% | 0% | 0% |
| Praise | 60% | 40% | 0% | 0% |
| Printed Materials | 56% | 44% | 0% | 0% |
| Score Interpretation | 28% | 48% | 16% | 8% |
| Test Security | 56% | 40% | 4% | 0% |
| Responses | |
|---|---|
| Student Answer Correct (QA and QT Agreed) | 645 (53.75%) |
| Student Answer Incorrect (QA and QT Agreed) | 310 (25.83%) |
| Not Administered | 244 (20.33%) |
| QA said Student Answer Correct; QT Disagreed | 1 (0.08%) |
The following plots provides a visual display of the responses from the nine different domains observed.
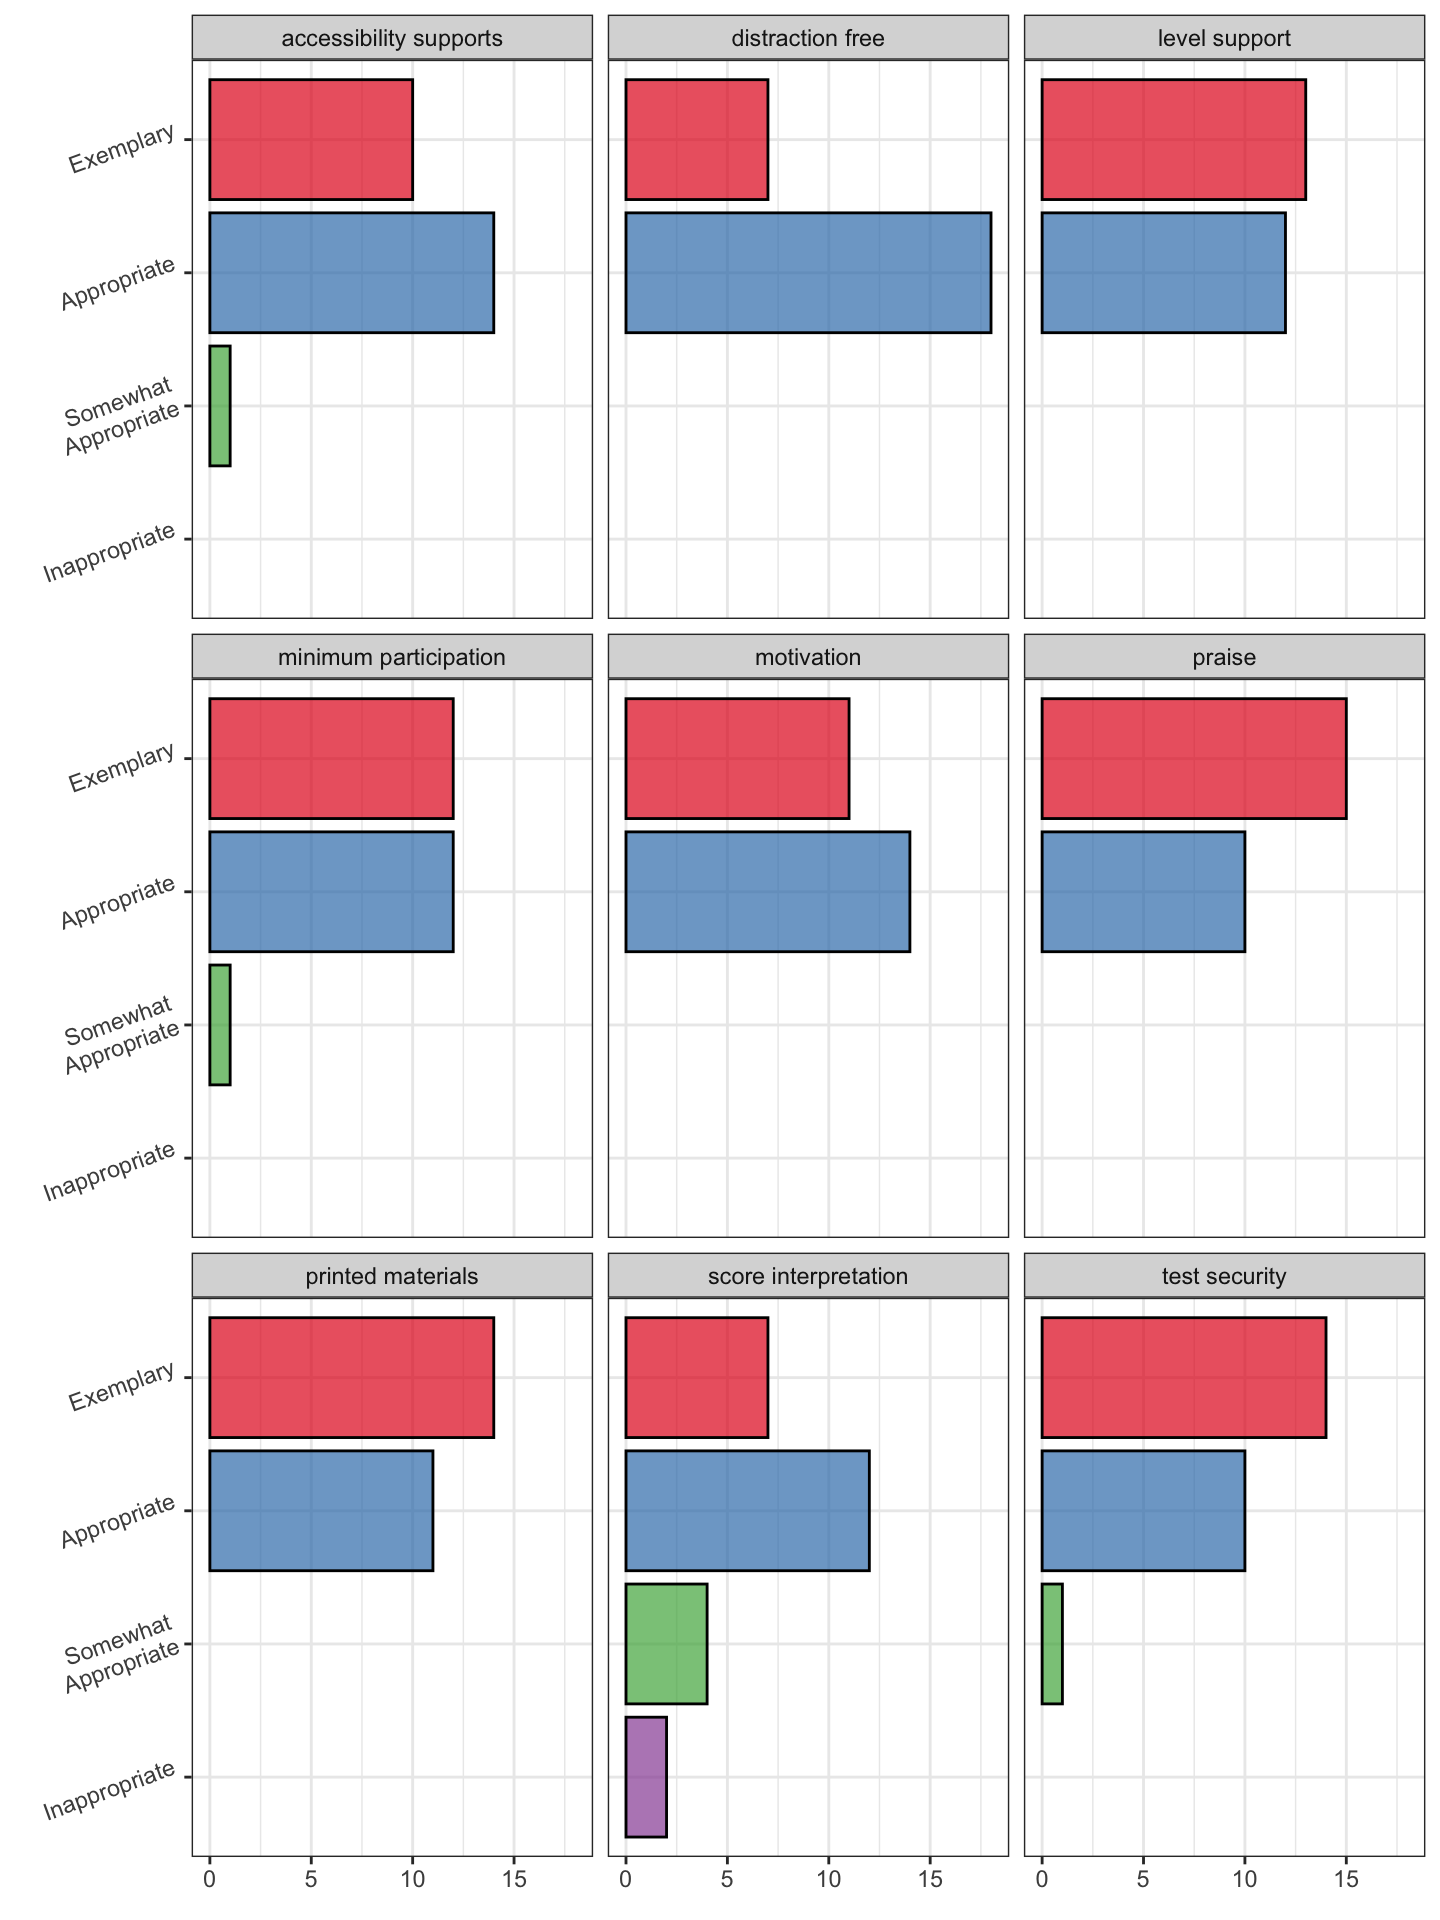
4.1.1.5 Results:
ORExt’s Selected response format provides for a high percentage of inter-rater reliability. One response out of the 1200 observed where observes disagreed with raters was in the ELA Writing scoring. ‘Score Interpretation’ appears to be a domain in need of additional training. Qualified Trainers indicated that 16% of observed Qualified Assessors were Somewhat Appropriate and 8% were Inappropriate in their understanding of how to use cut scores and achievement level descriptors to interpret scores.
4.1A Test Reliability
Marginal reliability results (true score variance/(true score variance + error variance)) demonstrate that the tests are quite reliable at the total test level. Full reliability statistics for each of the operational tests administered this year are provided below. These results demonstrate that the total test reliabilities were quite high, ranging from 0.8 to 0.94. Each table below provides the content area, grade, and the marginal reliabilities. All test forms were composed of 36 operational and 12 embedded field-test items; marginal reliability calculated with operational items and not field test.
| ELA | Math | Science | Reading | Writing | |
|---|---|---|---|---|---|
| Grade 3 | 0.91 | 0.9 | -- | 0.86 | 0.81 |
| Grade 4 | 0.92 | 0.9 | -- | 0.87 | 0.84 |
| Grade 5 | 0.92 | 0.89 | 0.91 | 0.87 | 0.83 |
| Grade 6 | 0.91 | 0.9 | -- | 0.87 | 0.81 |
| Grade 7 | 0.91 | 0.88 | -- | 0.86 | 0.82 |
| Grade 8 | 0.91 | 0.86 | 0.91 | 0.86 | 0.8 |
| High School | 0.94 | 0.92 | 0.93 | 0.9 | 0.9 |
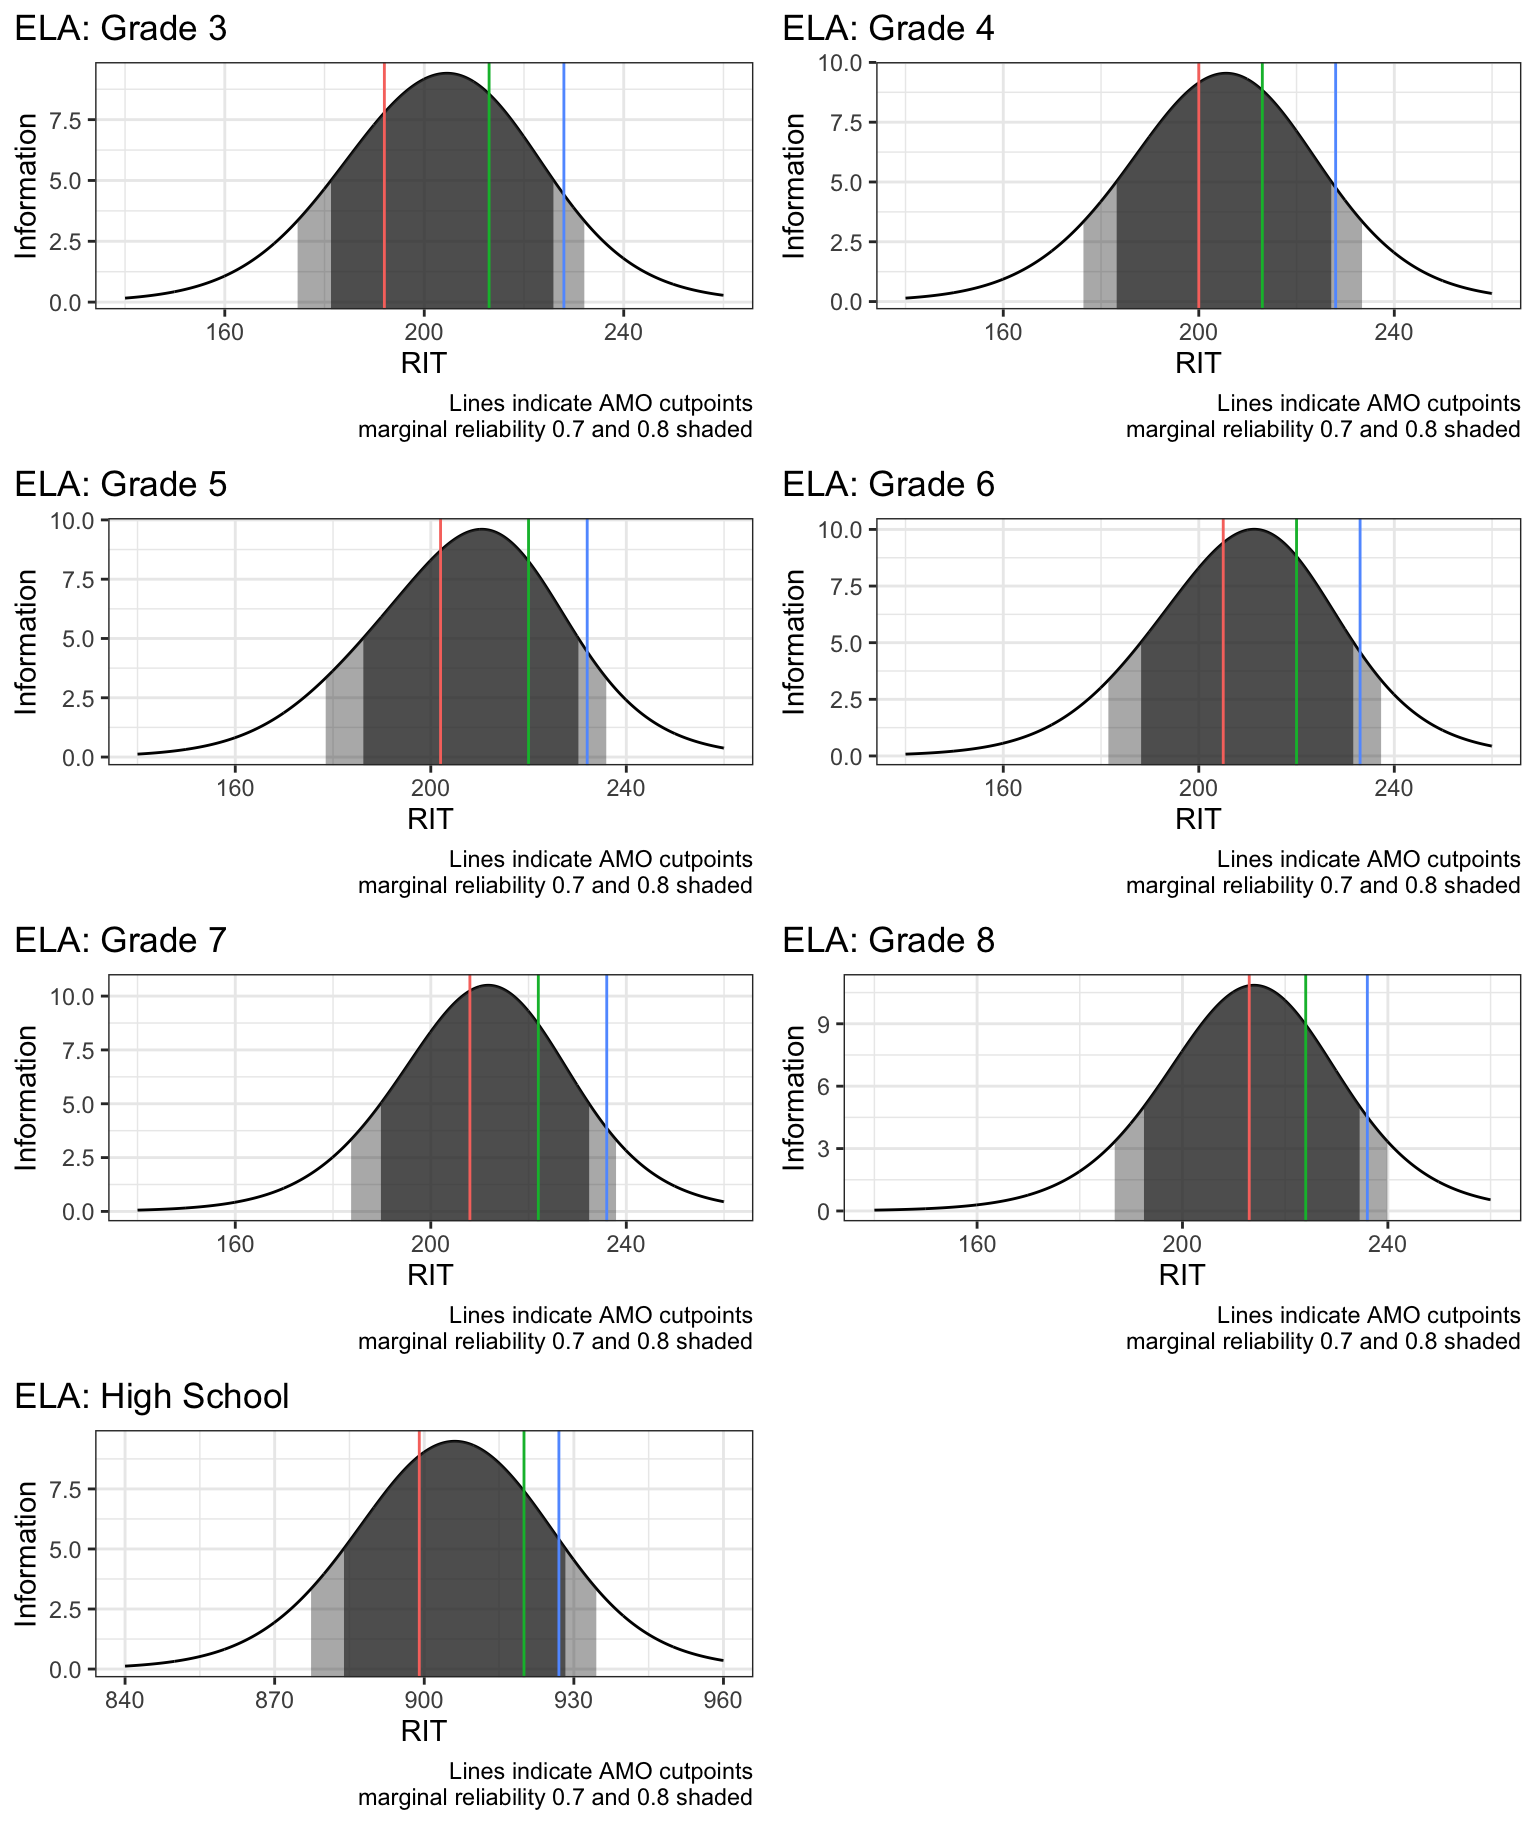
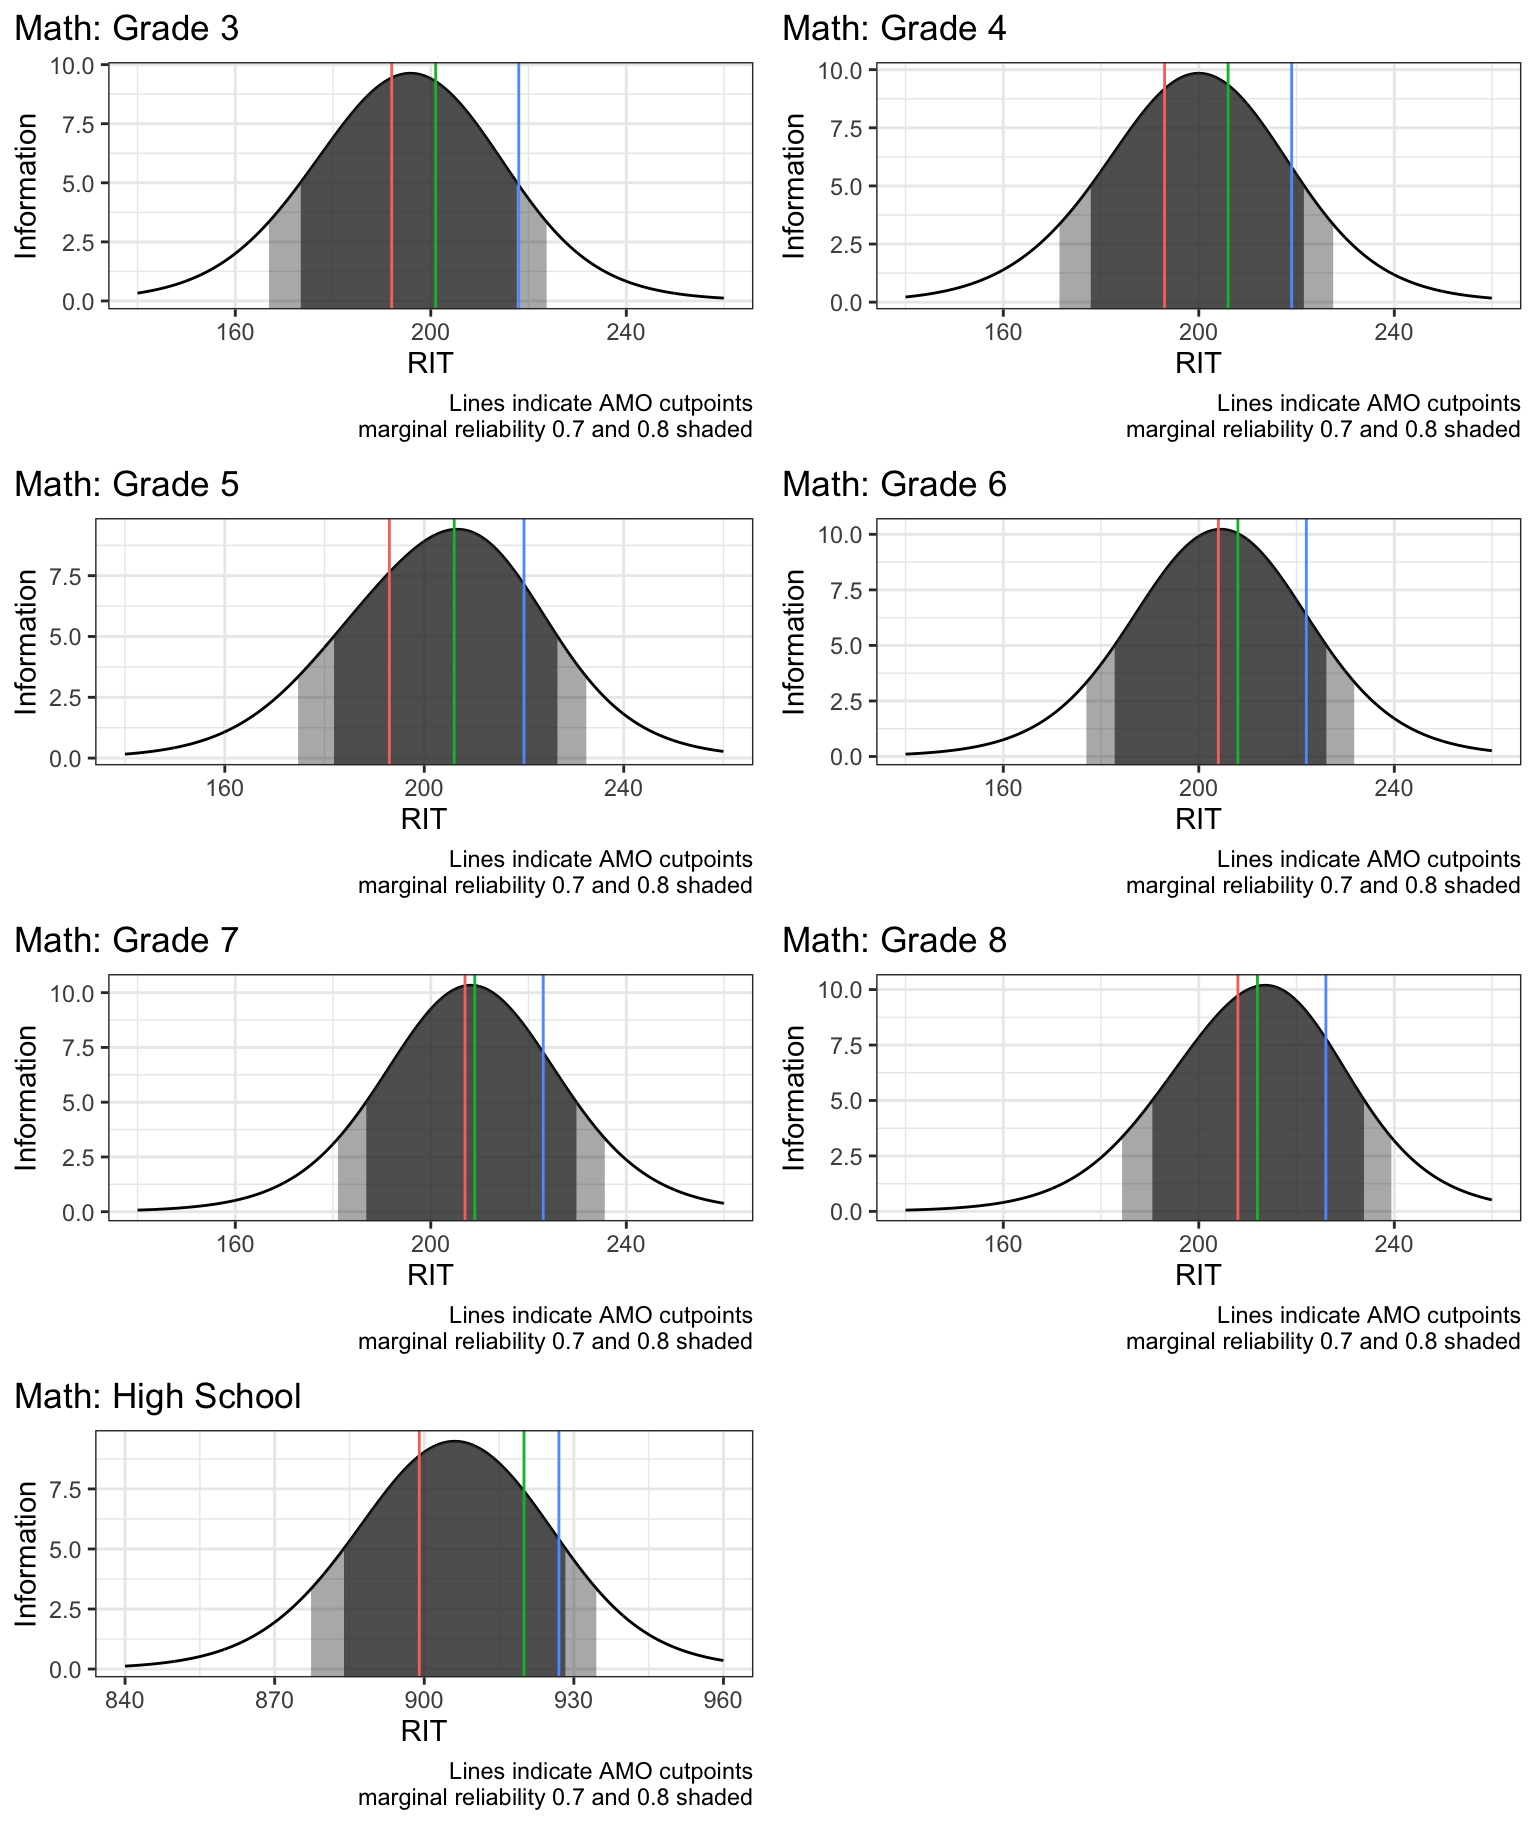
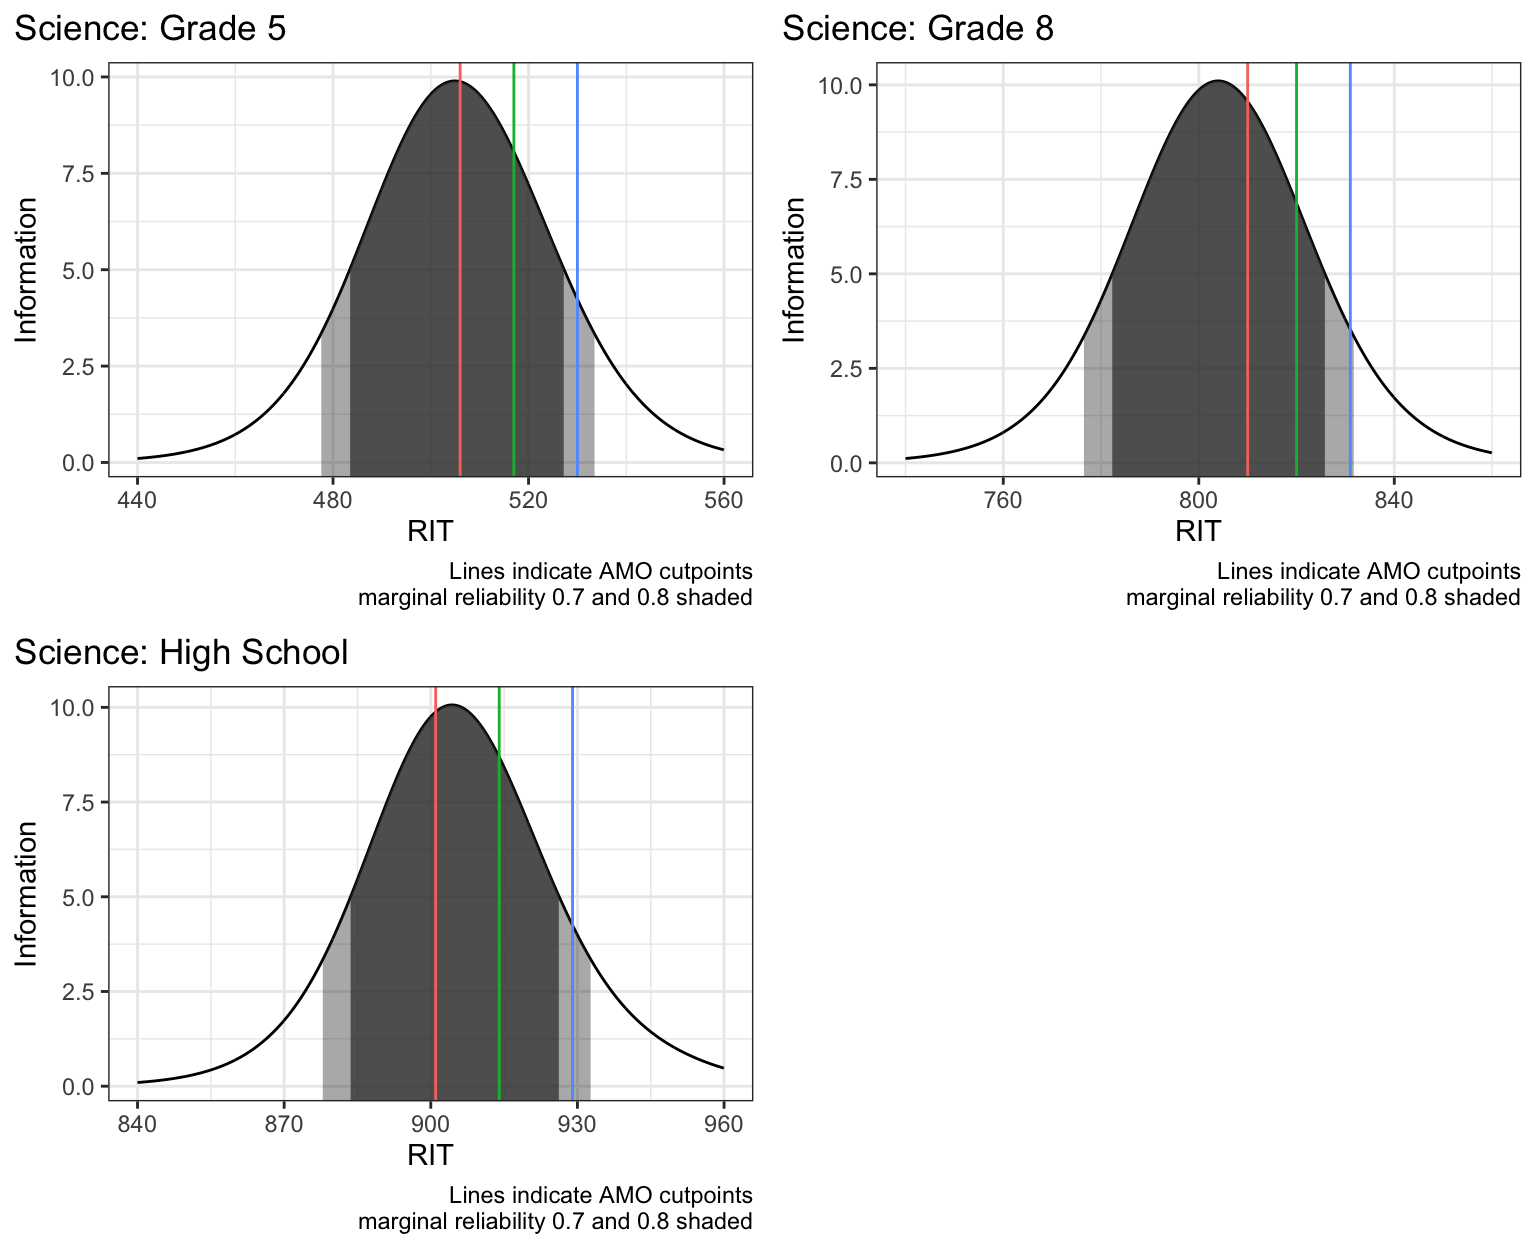
4.1B Test Information Functions
Test information functions shown below indicate cutpoints as vertical lines and acceptable marginal reliabilities (specifically dark gray = 0.8 and light gray = 0.7). All tests have the first two thresholds better than 0.8; for many grades and tests, this is also true for the final cut.
In a few cases, the marginal reliability of the final cut is not quite 0.8, but is still above 0.7. These can be seen as the tests with blue lines in the lighter gray region. Math has very high marginal reliability; only math grade 3 has marginal reliability between 0.7 and 0.8, all others are above 0.8.
This indicates that at the more difficult ends of the test, math items are providing more true variance, relative to the error variance. If other subjects’ items can be more greatly aligned with the constructs, these test information functions can be improved. Alternatively, more difficult item may be added to tests in the 0.7 to 0.8 marginal reliability range to improve the ratio of true variance to error variance in these tests.
4.1C English Language Arts TIFs
All tests except high school have the final cutpoint in the 0.7-0.8 marginal reliability range. To continue using this cutpoint, future iterations should replace some simpler items with more difficult items. High school’s final cutpoint is has adequate marginal reliability.
4.1D Mathematics TIFs
All tests except third grade math have the final cutpoint in above a marginal reliability of 0.8. For math grade 3, future iterations should replace at least one simpler items with a more difficult item.
4.1E Science TIFs
For all science grades, the final cutpoint is within the 0.7-0.8 range. Future tests should exchange some simpler items with more difficult items, especially in grade 8.
4.1F Validation of ORExt Vertical Scales
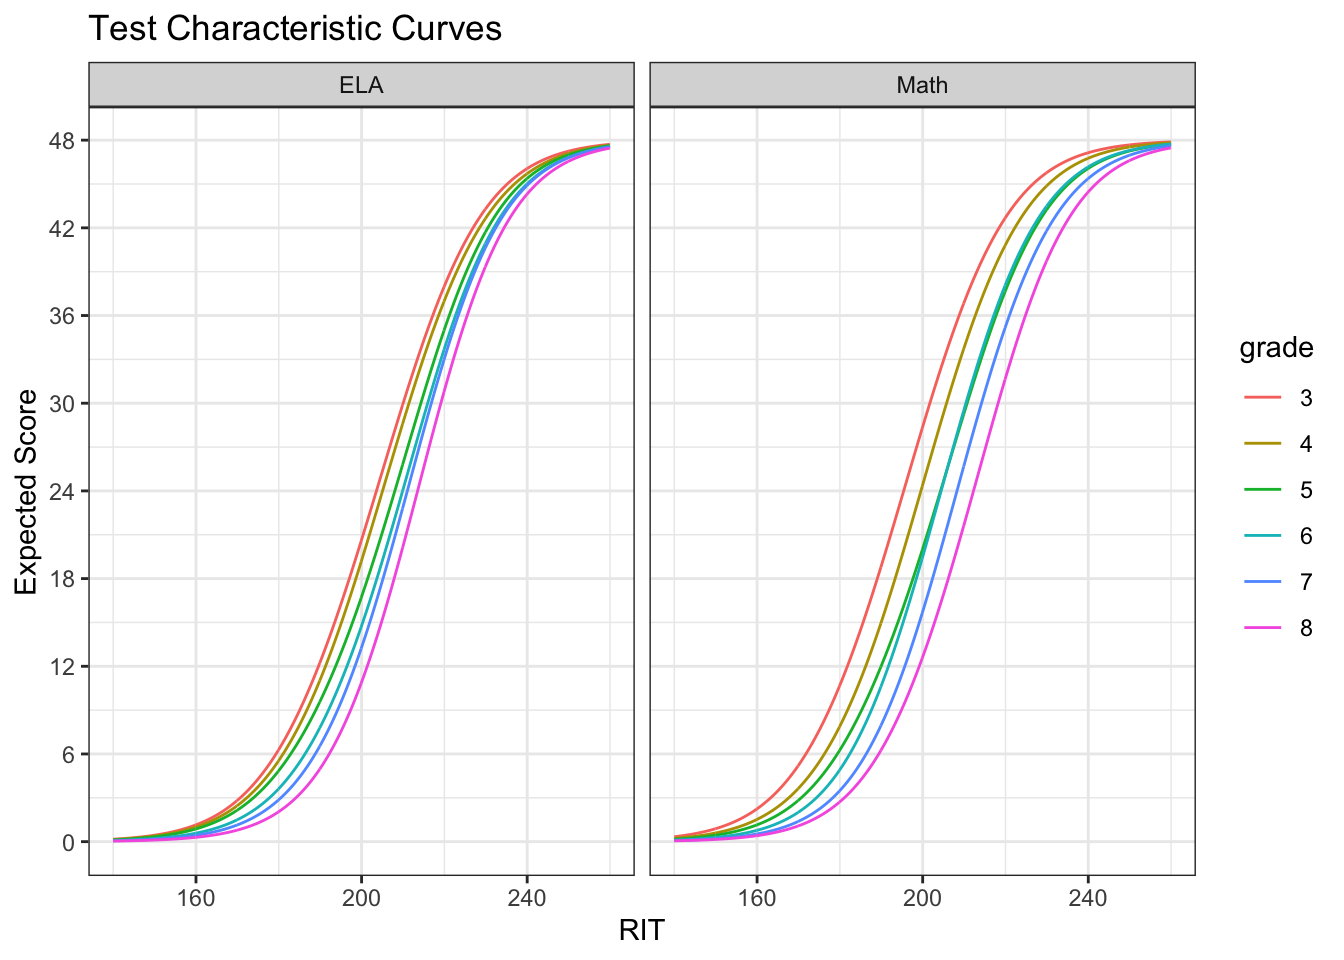
The Test Characteristic Curves (TCCs) for the grade-level assessments in ELA and mathematics demonstrate incrementally increasing growth and test demands across Grades 3-8, Grade 11 and science tests are not vertically scaled; TCCs are thus not presented for Grade 11 or science. All Rasch model scaling, as well as the data visualizations for the TCCs were conducted in the R software version 4.1.2 environment (R Core Team, 2021) using the exirt package (Anderson and Loan (2022)), which uses the TAM package for Rasch modeling (Robitzsch, Kiefer, and Wu (2022)).
Test characteristic curves demonstrate a very clear vertical scale. Only one pair of grades crosses (grade 5 and 6 math), indicating a very small inconsistency with the vertical scale. The magnitude of the cross is not dramatic, and the two tests demonstrate expected properties until they intersect roughly at 26 items. This can be improved by either making grade 5 slightly easier or grade 6 slightly harder via exchange of items with different difficulties. Otherwise, the spacing of curves looks roughly even across grades.
4.1G Overall and Conditional Standard Errors of Measurement (SEM)
Annual Measurable Objectives (AMO) are yearly learning targets set by the state in ELA, Math, and Science. Standard Error of Measurement (SEM) estimates how repeated measures of a person on the same instrument tend to be distributed around his or her “true” score. The average SEM associated with each cut score for 2021-22 student data are presented in the table below. See Section 4.2 below for means and standard deviations by grade and subject area. The numbers below, AMO is on the left and the SEM associated with the cut score is in parentheses, rounded to two decimals.
The AMO 2 cutscore represents the threshold between AMO 1 and AMO 2; similarly AMO 3 cutscore represents the threshold between AMO 2 and 3; AMO 4 represents the cutscore between AMO 3 and 4.
AMO levels correspond to the following descriptions:
- AMO Level 1 = Does Not Yet Meet
- AMO Level 2 = Nearly Meets
- AMO Level 3 = Meets
- AMO Level 4 = Exceeds
| AMO 2 Cutscore (SEM) | AMO 3 Cutscore (SEM) | AMO 4 Cutscore (SEM) | |
|---|---|---|---|
| ELA | |||
| Grade 3 | 193 (4.21) | 214 (3.97) | 230 (5.57) |
| Grade 4 | 201 (3.92) | 214 (4) | 231 (5.66) |
| Grade 5 | 204 (3.9) | 222 (4.29) | 235 (6.19) |
| Grade 6 | 206 (3.77) | 221 (4.01) | 236 (6.2) |
| Grade 7 | 209 (3.64) | 223 (4.07) | 237 (6.16) |
| Grade 8 | 214 (3.54) | 226 (4) | 239 (6.12) |
| High School | 900 (2.75) | 921 (3.09) | 928 (3.62) |
| Math | |||
| Grade 3 | 193 (3.81) | 203 (4) | 220 (5.61) |
| Grade 4 | 194 (3.79) | 207 (3.94) | 221 (5.13) |
| Grade 5 | 195 (4.07) | 207 (3.86) | 221 (4.5) |
| Grade 6 | 205 (3.58) | 209 (3.68) | 223 (4.98) |
| Grade 7 | 209 (3.57) | 210 (3.58) | 225 (4.4) |
| Grade 8 | 209 (3.7) | 213 (3.62) | 227 (4.19) |
| High School | 903 (2.58) | 908 (2.63) | 924 (3.53) |
| Science | |||
| Grade 5 | 507 (3.67) | 519 (4.15) | 533 (6.24) |
| Grade 8 | 812 (3.81) | 822 (4.5) | 832 (6.25) |
| High School | 902 (2.56) | 915 (2.83) | 932 (4.45) |
| Note: | |||
| AMO = Annual Measureable Objective | |||
| SEM = Standard Error of Measurement associated with the cut score | |||
4.1H Classification Accuracy & Consistency
Results from the 2021-22 ORExt test administration were analyzed using Rudner’s classification index (Rudner 2005). Results closer to 1.0 indicate the likelihood that a student was appropriately classified as proficient or not proficient (accuracy) and the likelihood that the student would be classified in the same category given an additional test administration (consistency). The calculation utilizes item difficulty and theta value distributions, as well as related standard errors of measurement, to generate probabilistic estimates based on one test administration. Complete results, generated from the cacIRT package in R (Lathrop (2015)), are provided below. Results denote very high levels of classification accuracy and consistency.
| AMO 2 (Nearly Meets) | AMO 3 (Meets) | AMO 4 (Exceeds) | |
|---|---|---|---|
| ELA | |||
| Grade 3 | Acc: 0.94 | Con: 0.92 | Acc: 0.92 | Con: 0.89 | Acc: 0.98 | Con: 0.97 |
| Grade 4 | Acc: 0.93 | Con: 0.9 | Acc: 0.93 | Con: 0.91 | Acc: 0.96 | Con: 0.94 |
| Grade 5 | Acc: 0.95 | Con: 0.92 | Acc: 0.93 | Con: 0.91 | Acc: 0.96 | Con: 0.94 |
| Grade 6 | Acc: 0.92 | Con: 0.9 | Acc: 0.93 | Con: 0.9 | Acc: 0.95 | Con: 0.94 |
| Grade 7 | Acc: 0.94 | Con: 0.92 | Acc: 0.94 | Con: 0.91 | Acc: 0.94 | Con: 0.92 |
| Grade 8 | Acc: 0.94 | Con: 0.92 | Acc: 0.94 | Con: 0.91 | Acc: 0.95 | Con: 0.93 |
| High School | Acc: 0.98 | Con: 0.97 | Acc: 0.96 | Con: 0.94 | Acc: 0.94 | Con: 0.92 |
| Math | |||
| Grade 3 | Acc: 0.91 | Con: 0.87 | Acc: 0.93 | Con: 0.9 | Acc: 0.99 | Con: 0.98 |
| Grade 4 | Acc: 0.9 | Con: 0.87 | Acc: 0.93 | Con: 0.9 | Acc: 0.98 | Con: 0.97 |
| Grade 5 | Acc: 0.91 | Con: 0.87 | Acc: 0.91 | Con: 0.88 | Acc: 0.98 | Con: 0.97 |
| Grade 6 | Acc: 0.91 | Con: 0.88 | Acc: 0.92 | Con: 0.89 | Acc: 0.97 | Con: 0.95 |
| Grade 7 | Acc: 0.9 | Con: 0.86 | Acc: 0.9 | Con: 0.86 | Acc: 0.97 | Con: 0.95 |
| Grade 8 | Acc: 0.86 | Con: 0.81 | Acc: 0.86 | Con: 0.81 | Acc: 0.99 | Con: 0.99 |
| High School | Acc: 0.93 | Con: 0.9 | Acc: 0.94 | Con: 0.91 | Acc: 0.99 | Con: 0.98 |
| Science | |||
| Grade 5 | Acc: 0.94 | Con: 0.92 | Acc: 0.94 | Con: 0.92 | Acc: 0.93 | Con: 0.91 |
| Grade 8 | Acc: 0.94 | Con: 0.92 | Acc: 0.93 | Con: 0.9 | Acc: 0.91 | Con: 0.88 |
| High School | Acc: 0.98 | Con: 0.97 | Acc: 0.96 | Con: 0.94 | Acc: 0.95 | Con: 0.93 |
For ELA accuracies are seen of 0.92 to 0.98 and consistencies of 0.89 to 0.97; For Math accuracies are seen of 0.86 to 0.99 and consistencies of 0.81 to 0.99; For Science accuracies are seen of 0.91 to 0.98 and consistencies of 0.88 to 0.97.
The ORExt is not a computer-adaptive instrument so estimate precision documentation based upon that test design is not provided.
4.2 Fairness and Accessibility
The state has taken steps to ensure fairness in the development of the assessments, including an analysis of each test item by Oregon teachers not only for linkage to standards, but also for access, sensitivity, and bias (see Oregon Extended Assessment Alignment Study). In addition, test functioning was reviewed as relevant to race/ethnicity and disability subgroups. This process increases the likelihood that students are receiving instruction in areas reflected in the assessment, and also that the items are not biased toward a particular demographic or sub-group.
4.2A Differential Item Functioning Analyses
To investigate Differential Item Functioning (DIF), the Mantel-Haenszel test using a purification process was conducted (Holland and Thayer 1988; Kamata and Vaughn 2004) with the R software using the difR package (Magis et al., 2013). When using the Mantel-Haenszel test to investigate DIF, contingency tables are constructed, and the resulting odds for the focal group answering the item correctly are compared to the odds for the reference group. Given n-size limitations (Scott et al. (2009)), we were able to conduct two analyses: a) White/Non-White and b) Male/Female. Whites and Males were the focal groups and Non-Whites and Females were the reference groups, respectively. The contingency table summarizes correct and incorrect responses to each item by respondents’ total raw score by subgroup (Kamata and Vaughn (2004)). If there is no difference in performance for the two groups, the odds ratio of the focal group performance to reference group performance will equal one. An odds ratio greater than one means the focal group is performing better than the reference group, with the opposite being true for odds ratios less than one.
The difR package contains a built in algorithm to conduct purification automatically, of interest was how this algorithm functioned relative to the iterations conducted manually using SPSS. Criteria was used as outlined by the Educational Testing Service (ETS) for DIF Classification (Holland and Thayer (1988)) to determine whether or not items exhibited DIF. The Holland and Thayer criteria were used for all Mantel-Haenszel analyses. As the difR package reports delta values by default, defined as \[\Delta_{MH} = -2.35*ln(\alpha_{MH})\].
It is common for negligible differences to exist between groups in data, for that reason, the focus of the DIF analysis is to remove items which display larger DIF. Below, a 3 category magnitude of effect for DIF is reported, with increasing magnitudes of the difference: A, B, and C. Refer to these as “Negligible”, “Small” and “Substantial”, respectively.
- A: \(0 > \delta <= 1\)
- B: \(1 > \delta <= 1.5\)
- C: \(1.5 > \delta\)
Items that were flagged as “C” were reviewed by BRT researchers for potential biases. If biases are identified, the item is removed from the item pool. Items categorized as “A” or “B” were considered smaller differences and do not rise to the level of exclusion in this wave of test administration. Continued examination of these items over time will ensure the differences remain below the threshold of \(\delta < 1.5\).
| Negligible Differences (A) | Small Differences (B) | Substantial Differences (C) | |
|---|---|---|---|
| ELA | |||
| Grade 3 | 30 | 3 | 3 |
| Grade 4 | 32 | 2 | 2 |
| Grade 5 | 29 | 3 | 4 |
| Grade 6 | 28 | 5 | 3 |
| Grade 7 | 32 | 4 | 0 |
| Grade 8 | 31 | 2 | 3 |
| High School | 30 | 5 | 1 |
| Math | |||
| Grade 3 | 30 | 6 | 0 |
| Grade 4 | 28 | 5 | 3 |
| Grade 5 | 29 | 6 | 1 |
| Grade 6 | 31 | 3 | 2 |
| Grade 7 | 29 | 4 | 3 |
| Grade 8 | 34 | 2 | 0 |
| High School | 23 | 6 | 7 |
| Science | |||
| Grade 5 | 29 | 4 | 3 |
| Grade 8 | 30 | 4 | 2 |
| High School | 28 | 2 | 6 |
In terms of the Male/Female analyses, a total of 43 items were flagged as “C”. This means there were substantial differences in the performance of those items by coded student sex, at the same ability level. Of these ELA favored 6 items for girls, Math favored 6 items for girls, Science favored 2 items for girls. That means that ELA favored 10 items for boys, Math favored 10 items for boys, Science favored 9 items for boys. This suggests that the items favor male more often than female by a total of 15 items. Items will be modify, such that items do not favor one group over the other; if that is not possible, achieving balance between number of items which favor these groups is important.
| Negligible Differences (A) | Small Differences (B) | Substantial Differences (C) | |
|---|---|---|---|
| ELA | |||
| Grade 3 | 23 | 9 | 4 |
| Grade 4 | 31 | 4 | 1 |
| Grade 5 | 27 | 8 | 1 |
| Grade 6 | 34 | 2 | 0 |
| Grade 7 | 33 | 3 | 0 |
| Grade 8 | 30 | 5 | 1 |
| High School | 22 | 10 | 4 |
| Math | |||
| Grade 3 | 34 | 0 | 2 |
| Grade 4 | 31 | 3 | 2 |
| Grade 5 | 33 | 2 | 1 |
| Grade 6 | 30 | 6 | 0 |
| Grade 7 | 33 | 3 | 0 |
| Grade 8 | 29 | 5 | 2 |
| High School | 28 | 7 | 1 |
| Science | |||
| Grade 5 | 31 | 4 | 1 |
| Grade 8 | 24 | 10 | 2 |
| High School | 25 | 6 | 5 |
In terms of the White/non-White analyses, a total of 27 items were flagged as “C”. Of these ELA favored 8 items for white participants, Math favored 4 items for white participants, Science favored 2 items for white participants. That means that ELA favored 3 items for non-white participants, Math favored 4 items for non-white participants, Science favored 6 items for non-white participants. This suggests that the items favor White more often than non-White by a total of 1 items. A balance of these items will be achieved in the next test administration. Items will be modify such that items do not favor one group over the other; if that is not possible, achieving balance between number of items which favor these groups is important.
4.2B Race - Ethnicity Percentages and Totals by Content Area and Grade Level
| White | Hispanic | Multi- ethnic | Asian | Black | Native American or Alaskan | |
|---|---|---|---|---|---|---|
| Grade 3 | 199 (52%) | 119 (31%) | 21 (5%) | 21 (5%) | 12 (3%) | 11 (3%) |
| Grade 4 | 208 (53%) | 123 (31%) | 31 (8%) | 20 (5%) | -- | -- |
| Grade 5 | 235 (55%) | 123 (29%) | 23 (5%) | 16 (4%) | 18 (4%) | -- |
| Grade 6 | 239 (55%) | 137 (31%) | 26 (6%) | 10 (2%) | 17 (4%) | -- |
| Grade 7 | 232 (53%) | 134 (31%) | 34 (8%) | 13 (3%) | 21 (5%) | -- |
| Grade 8 | 207 (51%) | 122 (30%) | 35 (9%) | 13 (3%) | 18 (4%) | -- |
| High School | 173 (55%) | 80 (25%) | 25 (8%) | 13 (4%) | 11 (3%) | -- |
| Note: | ||||||
| Samples Less than 10 Omitted for Privacy | ||||||
| Pacific Islander n < 10 at all grades |
The full ethnic and disability demographics for students taking the ORExt are reported below. Students ethnicity/race was reported in seven categories: (a) American Indian/Alaskan Native, (b) Asian, (c) Black or African-American, (d) Multi-ethnic, (e) Native Hawaiian or Other Pacific Islander, (f) Hispanic, or (g) White. Across grades, the majority of students were reported as White (51% to 55%). These results are largely consistent with the demographics reported for the general assessments, though percentages taking the ORExt are slightly higher for most students of color and generally lower for students who are Asian or White (see State Annual Report Card).
4.2C Exceptionality Percentages By Content Area and Grade Level
Autism Spectrum Disorder was the most common in Grade 3 (47.15%); Autism Spectrum Disorder was the most common in Grade 4 (41.62%); Autism Spectrum Disorder was the most common in Grade 5 (40.47%); Intellectual Disability was the most common in Grade 6 (37.39%); Intellectual Disability was the most common in Grade 7 (40.55%); Intellectual Disability was the most common in Grade 8 (46.29%); Intellectual Disability was the most common in Grade 11 (45.43%).
| IDEA Code | Amount of Sample |
|---|---|
| Grade 3 | |
| Autism Spectrum Disorder | 182 (47.15%) |
| Intellectual Disability | 100 (25.91%) |
| Other Health Impairment | 51 (13.21%) |
| Communication Disorder | 22 (5.7%) |
| Grade 4 | |
| Autism Spectrum Disorder | 164 (41.62%) |
| Intellectual Disability | 111 (28.17%) |
| Other Health Impairment | 70 (17.77%) |
| Communication Disorder | 15 (3.81%) |
| Emotional Disturbance | 12 (3.05%) |
| Orthopedic Impairment | 11 (2.79%) |
| Grade 5 | |
| Autism Spectrum Disorder | 172 (40.47%) |
| Intellectual Disability | 159 (37.41%) |
| Other Health Impairment | 52 (12.24%) |
| Specific Learning Disability | 13 (3.06%) |
| Grade 6 | |
| Intellectual Disability | 163 (37.39%) |
| Autism Spectrum Disorder | 152 (34.86%) |
| Other Health Impairment | 69 (15.83%) |
| Communication Disorder | 15 (3.44%) |
| Specific Learning Disability | 12 (2.75%) |
| Grade 7 | |
| Intellectual Disability | 178 (40.55%) |
| Autism Spectrum Disorder | 144 (32.8%) |
| Other Health Impairment | 61 (13.9%) |
| Specific Learning Disability | 16 (3.64%) |
| Orthopedic Impairment | 12 (2.73%) |
| Grade 8 | |
| Intellectual Disability | 187 (46.29%) |
| Autism Spectrum Disorder | 128 (31.68%) |
| Other Health Impairment | 44 (10.89%) |
| Specific Learning Disability | 18 (4.46%) |
| Grade 11 | |
| Intellectual Disability | 144 (45.43%) |
| Autism Spectrum Disorder | 115 (36.28%) |
| Other Health Impairment | 27 (8.52%) |
| Note: | |
| Samples Less than 10 Omitted for Privacy | |
| Secondary IDEA Code | Amount of Sample |
|---|---|
| Grade 3 | |
| Not Applicable | 305 (79.02%) |
| Communication Disorder | 43 (11.14%) |
| Other Health Impairment | 12 (3.11%) |
| Grade 4 | |
| Not Applicable | 274 (69.54%) |
| Communication Disorder | 44 (11.17%) |
| Other Health Impairment | 29 (7.36%) |
| Intellectual Disability | 18 (4.57%) |
| Grade 5 | |
| Not Applicable | 315 (74.12%) |
| Communication Disorder | 40 (9.41%) |
| Other Health Impairment | 33 (7.76%) |
| Grade 6 | |
| Not Applicable | 300 (68.81%) |
| Communication Disorder | 50 (11.47%) |
| Other Health Impairment | 37 (8.49%) |
| Intellectual Disability | 22 (5.05%) |
| Grade 7 | |
| Not Applicable | 309 (70.39%) |
| Communication Disorder | 36 (8.2%) |
| Other Health Impairment | 23 (5.24%) |
| Intellectual Disability | 21 (4.78%) |
| Autism Spectrum Disorder | 15 (3.42%) |
| Orthopedic Impairment | 14 (3.19%) |
| Grade 8 | |
| Not Applicable | 294 (72.77%) |
| Communication Disorder | 32 (7.92%) |
| Other Health Impairment | 20 (4.95%) |
| Intellectual Disability | 18 (4.46%) |
| Orthopedic Impairment | 14 (3.47%) |
| Grade 11 | |
| Not Applicable | 213 (67.19%) |
| Other Health Impairment | 33 (10.41%) |
| Intellectual Disability | 23 (7.26%) |
| Communication Disorder | 20 (6.31%) |
| Note: | |
| Samples Less than 10 Omitted for Privacy | |
4.2D Observed Means and Standard Deviations
The following tables provide information regarding observed means and standard deviations by content area and grade level. The Grade 3-8 English language arts and mathematics scaled scores are centered on 200, while all Grade 11 scores are centered on 900 (to reinforce that they are not on the vertical scale). Science is centered on 500 at Grade 5 and centered on 800 at Grade 8. These scales were selected to clearly determine whether scores are on the same scale and also to differentiate among the statewide assessments in use to avoid confusion (i.e., SBA, OAKS, ORExt, ELPA, KA).
The vertically scaled scores generally convey incremental gains in achievement across grade levels, which is seen here by both measures of central tendency (i.e., mean and median) for all tests.
| RIT Median | RIT Mean (SD) | |
|---|---|---|
| ELA | ||
| Grade 3 | 204 | 202.25 (18.29) |
| Grade 4 | 208 | 206.4 (19.42) |
| Grade 5 | 211 | 210.44 (20.65) |
| Grade 6 | 215 | 212.13 (20.76) |
| Grade 7 | 216 | 214.75 (22.04) |
| Grade 8 | 217 | 215.98 (21.64) |
| High School | 914 | 910.92 (27.39) |
| Math | ||
| Grade 3 | 191 | 189.99 (16.83) |
| Grade 4 | 198 | 195.29 (16.98) |
| Grade 5 | 200 | 197.99 (14.71) |
| Grade 6 | 203 | 201.04 (17.54) |
| Grade 7 | 207 | 203.28 (16.27) |
| Grade 8 | 209 | 204.52 (15.05) |
| High School | 900 | 896.79 (18.42) |
| Science | ||
| Grade 5 | 511 | 510.25 (21.25) |
| Grade 8 | 816 | 813.22 (22.58) |
| High School | 915 | 911.59 (28.17) |
4.2.0.1 Observed Means Reported by Sex
The following tables provide information regarding average student performance by grade level and sex (Female/Male) in each of the content areas assessed on the ORExt. Welch’s two sample t-tests demonstrate that ELA Grade 5 favors girls significantly (p = 0.027); ELA Grade 6 favors girls significantly (p = 0.013); Math Grade 4 favors boys significantly (p = 0.031); Science Grade 5 favors girls significantly (p = 0.049).
| Female RIT Mean (RIT SD) | Male RIT Mean (RIT SD) | |
|---|---|---|
| ELA | ||
| Grade 3 | 201.33 (19.15) | 202.59 (17.99) |
| Grade 4 | 207.33 (19.83) | 205.99 (19.26) |
| Grade 5 | 213.63 (18.74) | 209.03 (21.32) |
| Grade 6 | 215.49 (18.08) | 210.49 (21.78) |
| Grade 7 | 215.66 (21.99) | 214.27 (22.1) |
| Grade 8 | 216.38 (22.11) | 215.78 (21.43) |
| High School | 912.21 (25.86) | 910.27 (28.18) |
| Math | ||
| Grade 3 | 187.78 (16.31) | 190.8 (16.98) |
| Grade 4 | 192.48 (17.3) | 196.57 (16.71) |
| Grade 5 | 199.66 (12.25) | 197.24 (15.65) |
| Grade 6 | 202.57 (13.97) | 200.31 (18.99) |
| Grade 7 | 202.66 (14.65) | 203.61 (17.08) |
| Grade 8 | 203.87 (15.01) | 204.85 (15.09) |
| High School | 896.46 (17.09) | 896.96 (19.11) |
| Science | ||
| Grade 5 | 513.13 (18.46) | 508.96 (22.3) |
| Grade 8 | 812.14 (21.48) | 813.76 (23.13) |
| High School | 911.02 (26.15) | 911.88 (29.21) |
4.2.0.2 Observed Means Reported by Race
The following table provides information regarding average student performance by grade level and race/ethnicity in each of the content areas assessed on the ORExt.
| White | Hispanic | Asian | Multi- ethnic | Black | Native American or Alaskan | |
|---|---|---|---|---|---|---|
| ELA | ||||||
| Grade 3 | 202.4 (18.99) | 201.78 (17.42) | 203.71 (18.58) | 202.65 (15.41) | 203.17 (13.62) | 205.45 (18.28) |
| Grade 4 | 207.6 (20.69) | 203.84 (18.42) | 203.53 (16.43) | 212.48 (13.42) | -- | -- |
| Grade 5 | 211.44 (20.18) | 207.99 (22.77) | 215 (13.81) | 206.41 (16.45) | 209.06 (18.18) | -- |
| Grade 6 | 212.69 (22.47) | 212.28 (16.98) | -- | 210.44 (21.58) | 211.56 (19.34) | -- |
| Grade 7 | 216.16 (23.07) | 214.95 (20.37) | 206 (23.71) | 209.52 (22.56) | 211.3 (14.83) | -- |
| Grade 8 | 216.31 (22.81) | 211.83 (20.35) | 218.62 (7.58) | 221.97 (20.69) | 222.65 (19.62) | -- |
| High School | 912.3 (28.4) | 908.49 (26.58) | 909.33 (26.12) | 906.46 (28.11) | -- | -- |
| Math | ||||||
| Grade 3 | 190.17 (16.29) | 188.42 (18.41) | 192.3 (15.37) | 191.95 (18.08) | 189.92 (12.47) | 197.09 (12.93) |
| Grade 4 | 196.09 (17.48) | 192.97 (17.53) | 192.26 (16.77) | 202.1 (9.5) | -- | -- |
| Grade 5 | 199.12 (14.24) | 194.66 (16.13) | 202.19 (8.27) | 198 (16.43) | 200 (12.26) | -- |
| Grade 6 | 201.42 (18.78) | 201.13 (14.33) | -- | 200.08 (18.33) | 202.12 (19.49) | -- |
| Grade 7 | 204.62 (16.03) | 202.62 (16.2) | 198.23 (15.04) | 197.55 (19.42) | 203.21 (11.99) | -- |
| Grade 8 | 203.55 (16.16) | 203.93 (15.06) | 207.15 (6.93) | 207.88 (12.29) | 209.69 (7.35) | -- |
| High School | 897.6 (18.57) | 894.82 (19.89) | 896.33 (15.92) | 894.92 (18.21) | -- | -- |
| Science | ||||||
| Grade 5 | 512.24 (21.38) | 505.79 (21.97) | 509.06 (8.81) | 510.05 (18.99) | 515.94 (19.37) | -- |
| Grade 8 | 813.8 (23.66) | 808.43 (21.86) | 815.54 (10.08) | 818.82 (20.23) | 822.83 (17.31) | -- |
| High School | 914.78 (27.61) | 907.51 (28.57) | 892.64 (24.23) | 906.62 (30.88) | -- | -- |
| Note: | ||||||
| Samples Less than 10 Omitted for Privacy | ||||||
| Pacific Islander n < 10 at all grades | ||||||
4.2.0.3 Observed Means Reported by Exceptionality Status
The following table is a number key for Eligibility Codes:
4.2.0.3.1 Eligibility Codes List
- 0 Not Applicable
- 10 Intellectual Disability
- 20 Hearing Impairment
- 40 Vision Impairment
- 43 Deafblindness
- 50 Communication Disorder
- 60 Emotional Disturbance
- 70 Orthopedic Impairment
- 74 Traumatic Brain Injury
- 80 Other Health Impairment
- 82 Autism Spectrum Disorder
- 90 Specific Learning Disability
- 98 Developmental Delay (3-10)
| Primary IDEA Code | ELA | Math | Science |
|---|---|---|---|
| Grade 3 | |||
| Autism Spectrum Disorder (82) | 200.34 (20.16) | 187.98 (17.97) | -- |
| Communication Disorder (50) | 211.27 (11.52) | 200.59 (11.32) | -- |
| Intellectual Disability (10) | 203.33 (15.14) | 190.92 (15.02) | -- |
| Other Health Impairment (80) | 202.27 (17.96) | 188.61 (15.77) | -- |
| Grade 4 | |||
| Autism Spectrum Disorder (82) | 204.71 (18.97) | 194.81 (16.11) | -- |
| Communication Disorder (50) | 209.47 (15.9) | 200.17 (10.94) | -- |
| Emotional Disturbance (60) | 219.17 (14.71) | 207.17 (13.57) | -- |
| Intellectual Disability (10) | 209.79 (15.34) | 196.59 (13.54) | -- |
| Orthopedic Impairment (70) | 177.73 (21.21) | 168.27 (20.64) | -- |
| Other Health Impairment (80) | 204.64 (22.88) | 194.1 (20.76) | -- |
| Grade 5 | |||
| Autism Spectrum Disorder (82) | 208.41 (21.32) | 197.92 (15.82) | 505.74 (20.97) |
| Intellectual Disability (10) | 211.89 (18.16) | 198.32 (13.1) | 513.39 (18.41) |
| Other Health Impairment (80) | 208.17 (19.21) | 196.39 (12.34) | 508.29 (21.06) |
| Specific Learning Disability (90) | 227.15 (20.7) | 207.31 (10.16) | 533.92 (10.8) |
| Grade 6 | |||
| Autism Spectrum Disorder (82) | 210.08 (21.33) | 201.09 (18.23) | -- |
| Communication Disorder (50) | 220.6 (11.28) | 211.07 (15.33) | -- |
| Intellectual Disability (10) | 213.23 (19.6) | 200.87 (15.54) | -- |
| Other Health Impairment (80) | 212.82 (18.68) | 199.97 (17.52) | -- |
| Specific Learning Disability (90) | 234.17 (12.36) | 217.09 (7.94) | -- |
| Grade 7 | |||
| Autism Spectrum Disorder (82) | 212.39 (22.27) | 202.88 (16.65) | -- |
| Intellectual Disability (10) | 215.72 (20) | 203.07 (13.54) | -- |
| Orthopedic Impairment (70) | 190.25 (20.48) | 184.75 (17.45) | -- |
| Other Health Impairment (80) | 214.82 (25.82) | 202.07 (19.47) | -- |
| Specific Learning Disability (90) | 229.25 (13.37) | 220 (7.42) | -- |
| Grade 8 | |||
| Autism Spectrum Disorder (82) | 214.86 (22.52) | 205.1 (14.96) | 810.73 (22.42) |
| Intellectual Disability (10) | 216.9 (18.87) | 204.47 (12.9) | 814.6 (20.01) |
| Other Health Impairment (80) | 212.77 (24.6) | 202.33 (16.7) | 809.21 (24.72) |
| Specific Learning Disability (90) | 236.61 (14.88) | 218.33 (9.48) | 835 (14.8) |
| High School | |||
| Autism Spectrum Disorder (82) | 907.05 (29.79) | 894.45 (20.21) | 907.42 (31.41) |
| Intellectual Disability (10) | 910.55 (21.05) | 897.23 (14.78) | 911.71 (22.8) |
| Other Health Impairment (80) | 920.87 (30.64) | 899.91 (20.77) | 920.22 (31.21) |
| Note: | |||
| Samples Less than 10 Omitted for Privacy | |||
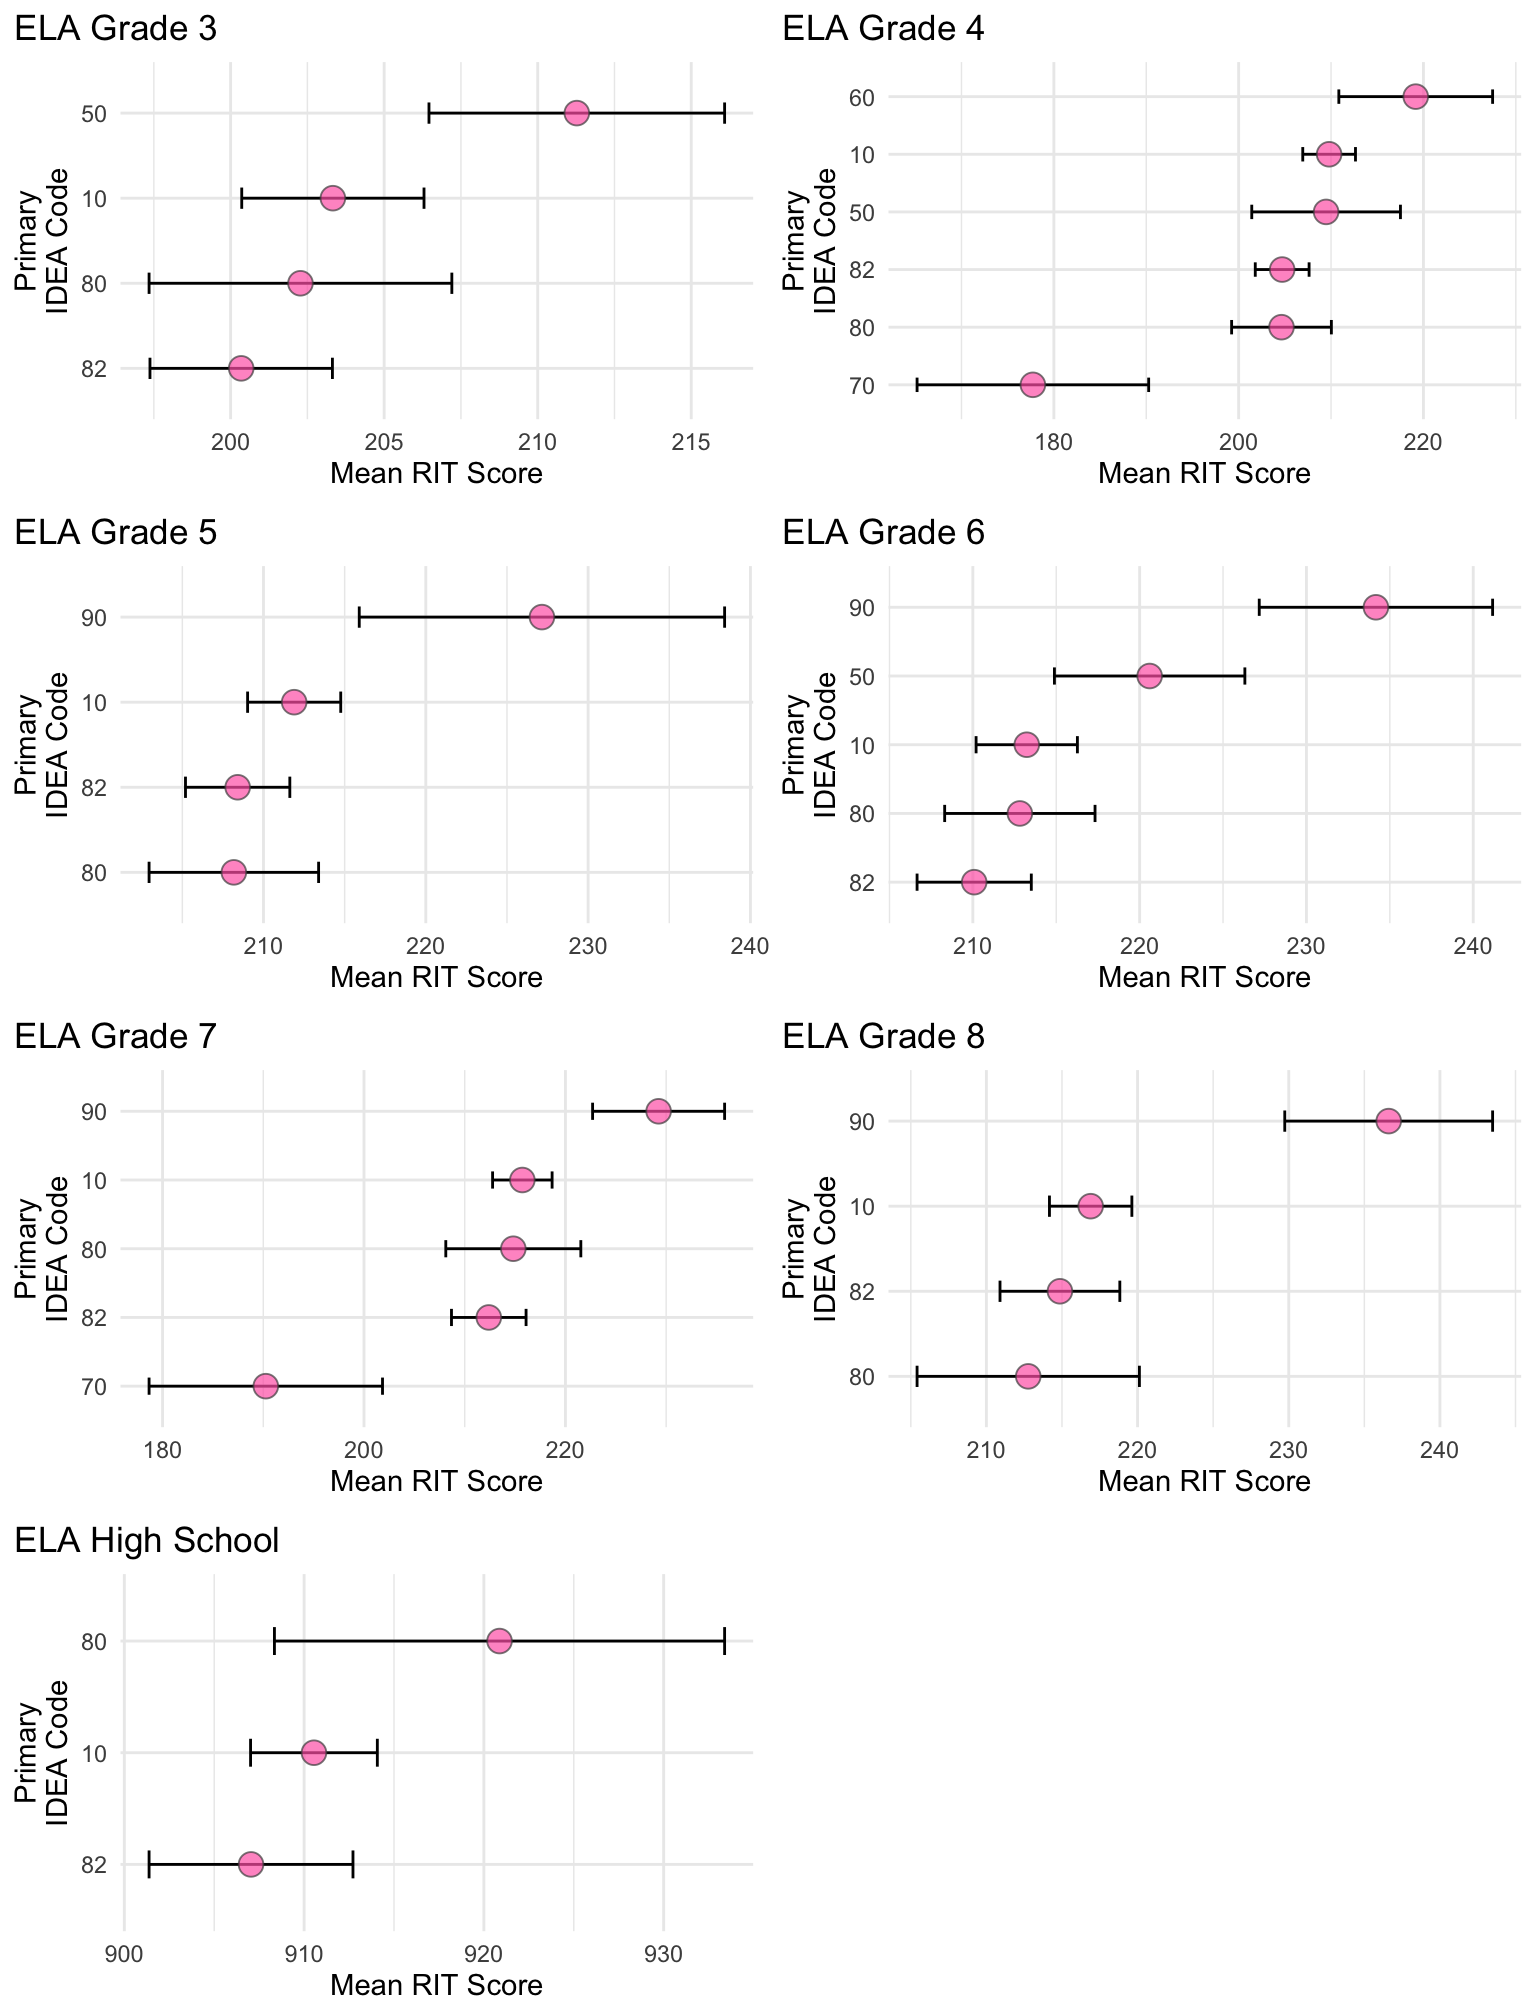
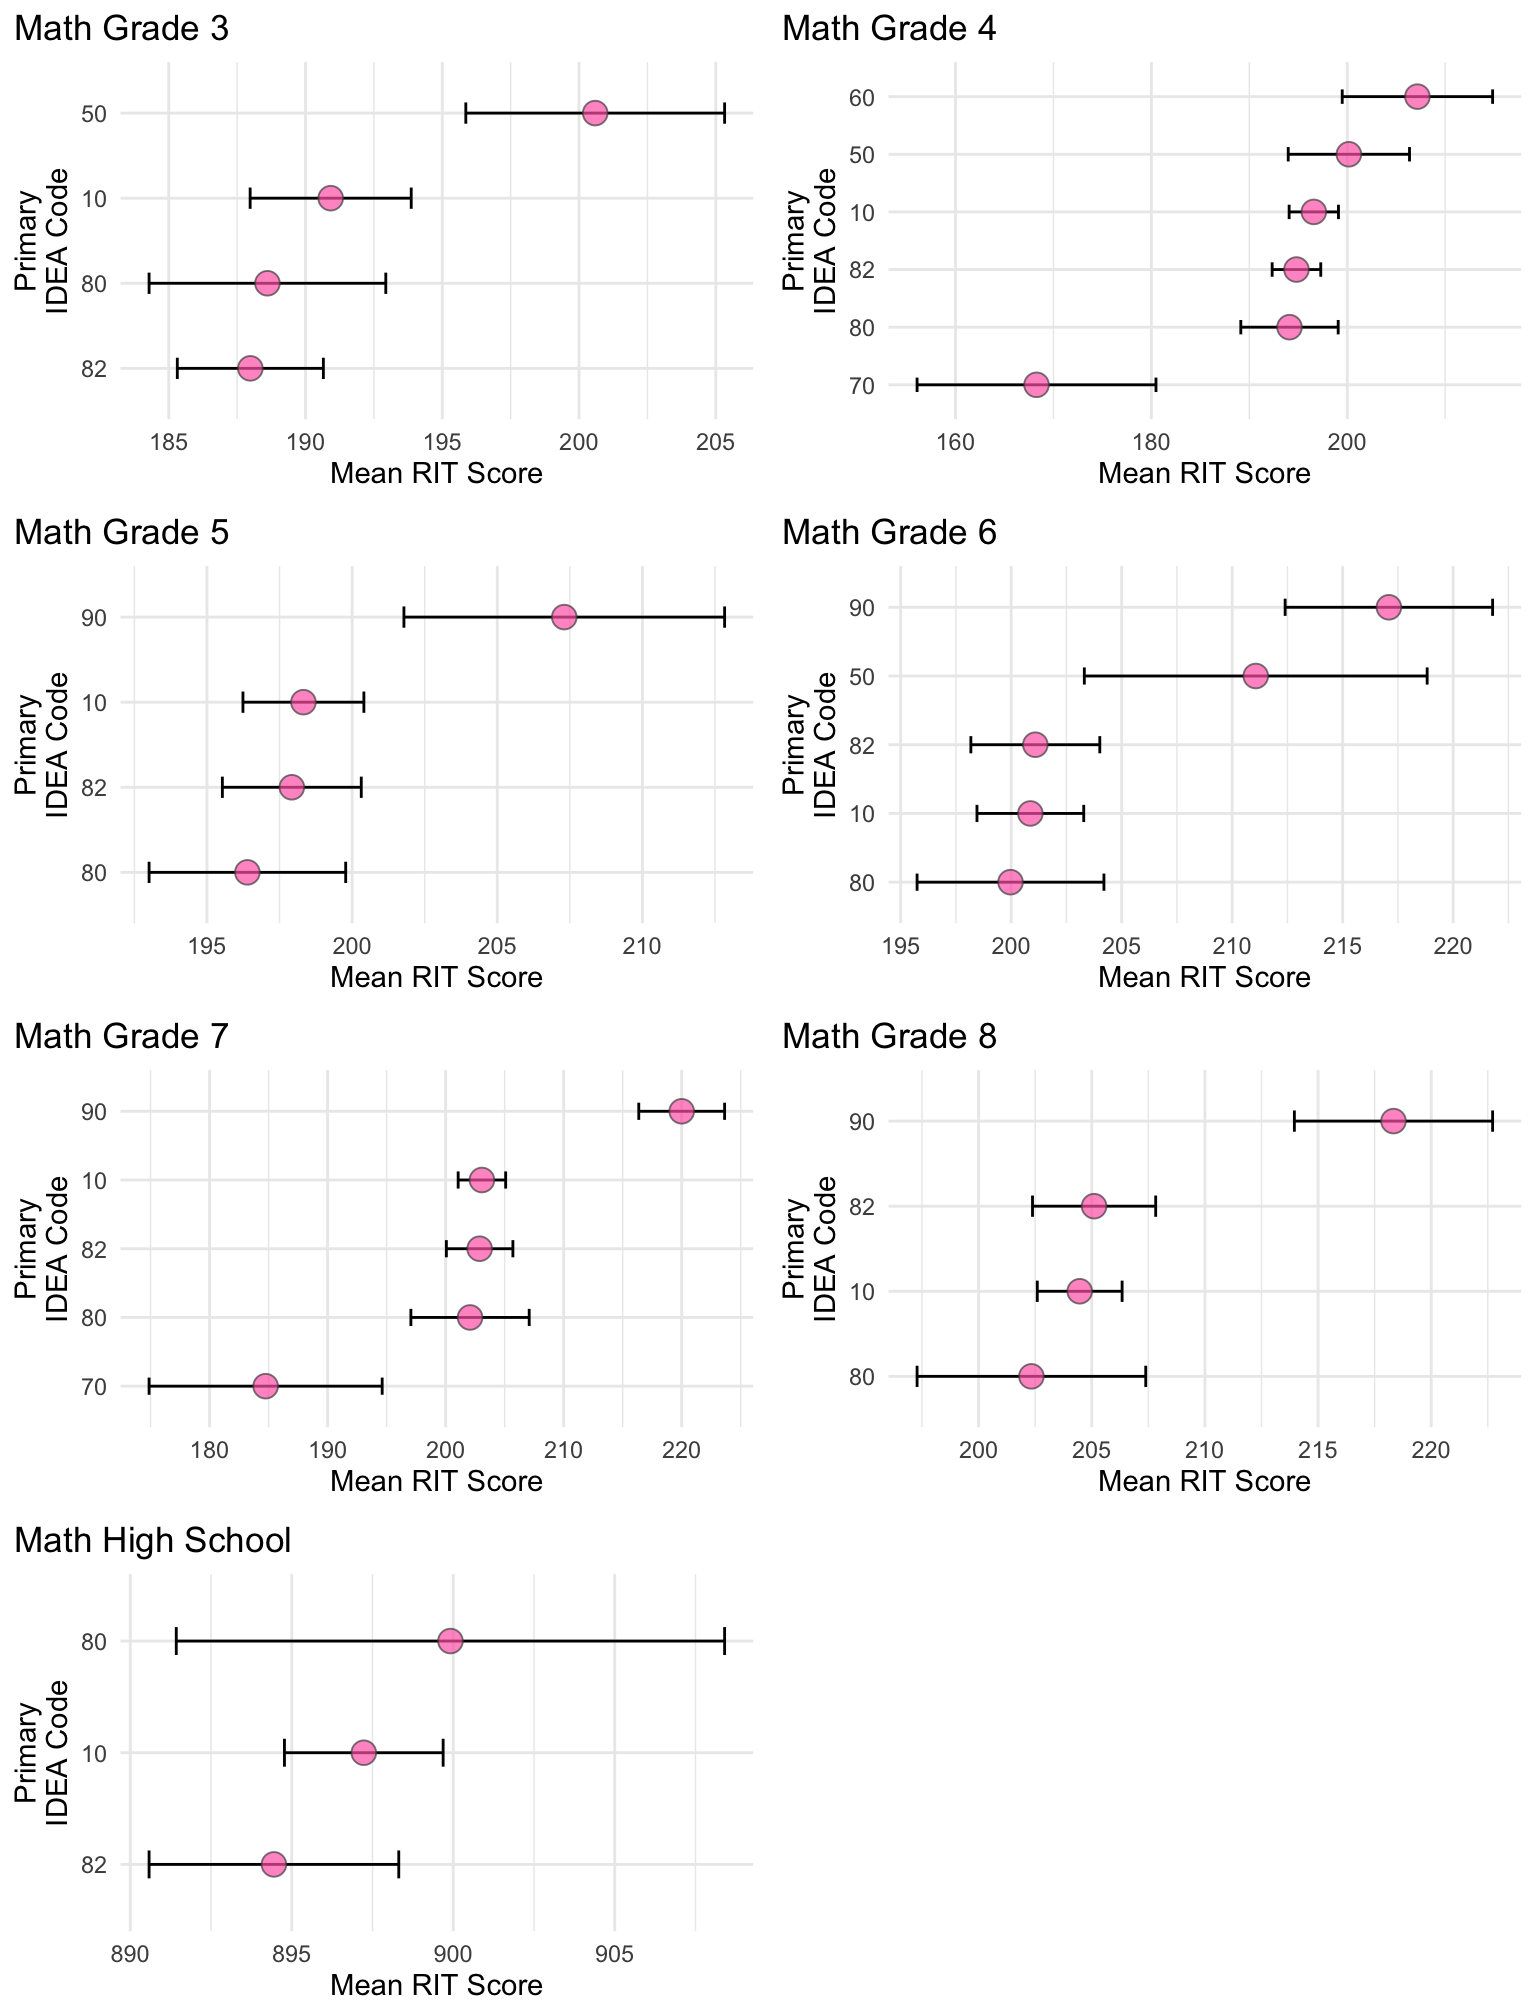
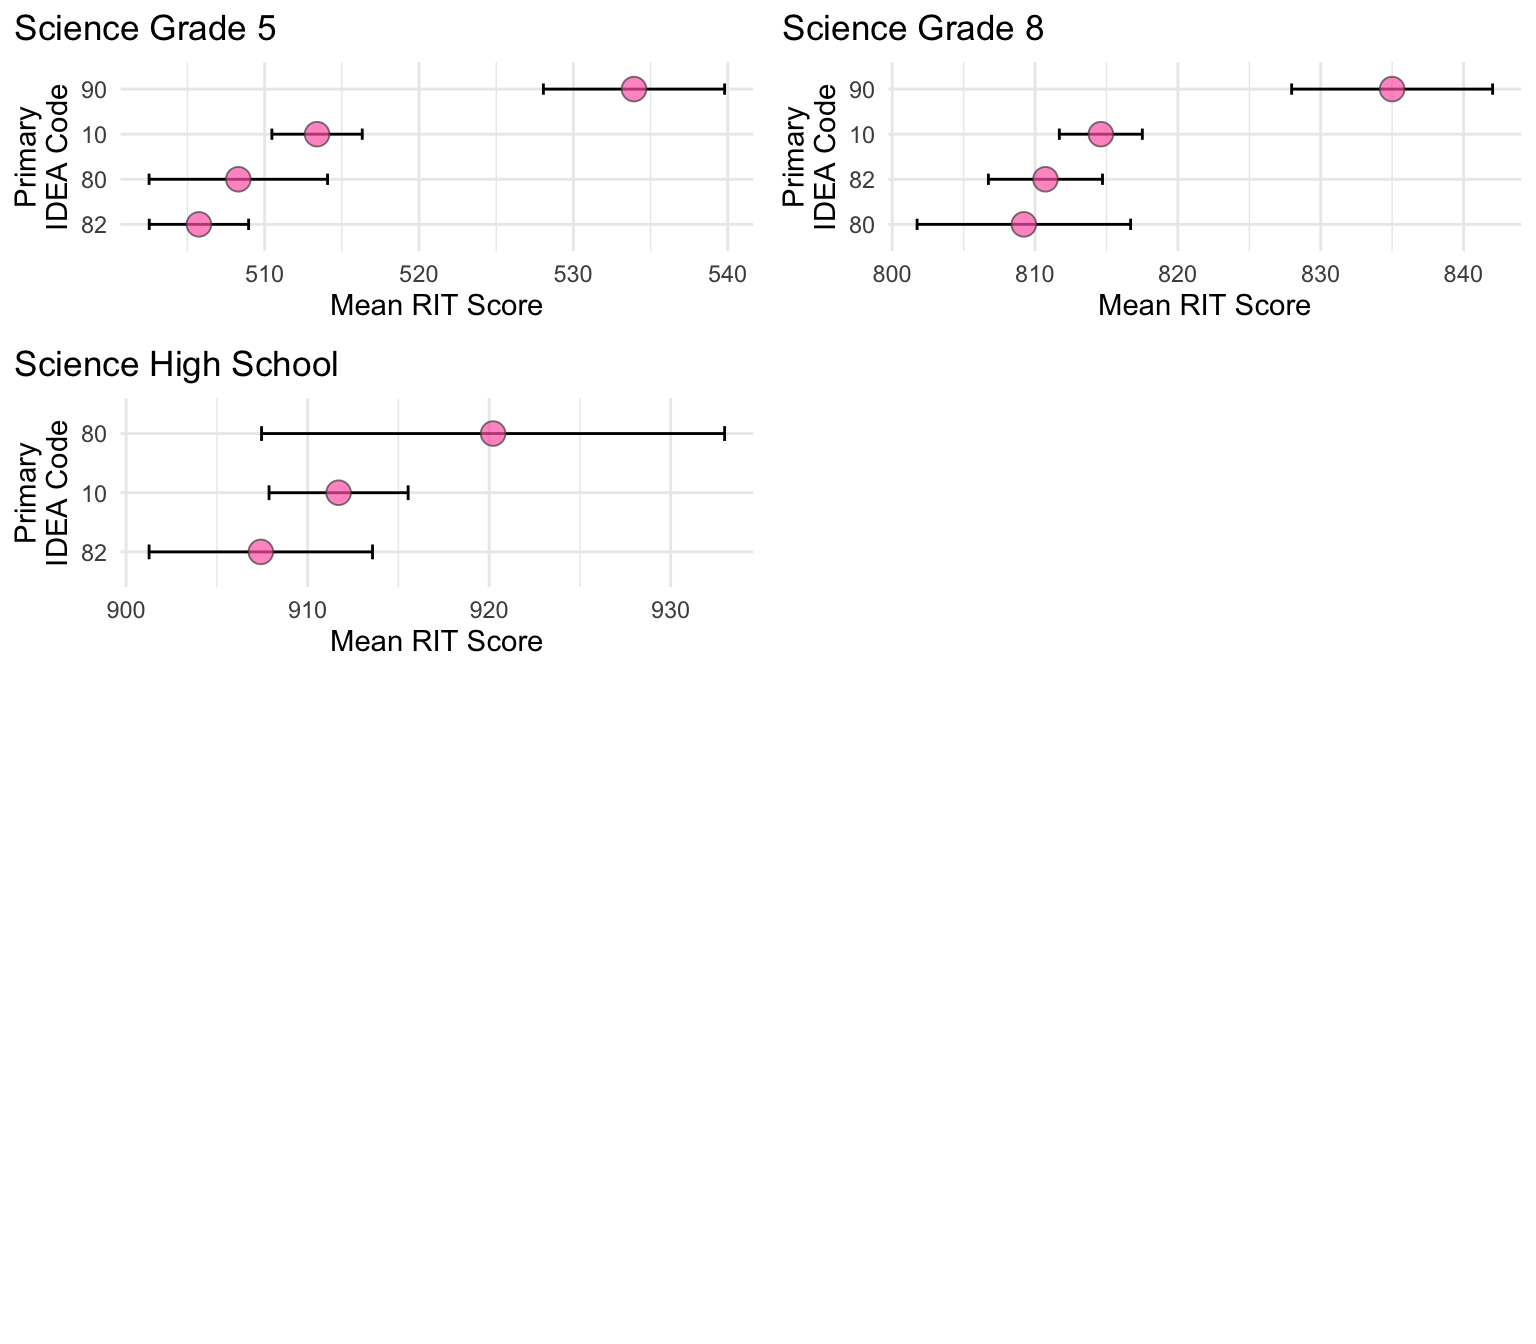
4.2.0.4 Graphs of Observed Means By Disability
The graphs below convey information similar to that shared above in graphic form. The graphics include 95% confidence interval error bars, so determining which subgroups performed in a manner that is significantly better than others is readily apparent by looking at the location of the error bars. Error bars that do not overlap are significantly different. In all cases, groups were not reported when smaller than 10 individuals for privacy.
4.3 Full Performance Continuum
The ORExt is designed to sample the Common Core State Standards in English language arts (Reading, Writing, and Language) and Mathematics, as well as the Oregon Science Standards and Next Generation Science Standards in science in a purposeful, validated manner. The ORExt test blueprints convey the balance of representation exhibited by the assessment (see ORExt Test Blueprint). These test blueprints are supported by the ORExt Extended Assessment Frameworks, which define the assessable content on the ORExt that has been reduced in depth, breadth, and complexity (RDBC) using our defined process (see Reducing the Depth, Breadth, and Complexity of Items). The decisions regarding which standards to target for essentialization, as well as the strength of linkage between the Essentialized Standards and the CCSS/ORSci/NGSS has been validated by Oregon teachers, as well (see Oregon Extended Assessment Alignment Study).
Though a simplified and standardized approach was taken to design items, and efficiency and access to the assessment increased for the majority of students (as evidenced by the decreased percentages of zero scores across all content areas), a small subgroup of students remains who cannot access an academic assessment. This is true even though items have been significantly RDBC at three levels of complexity (low-medium-high difficulty). As a response, ODE commissioned BRT to design and implement an observational rating scale for this group of very low-performing students, called the Oregon Observational Rating Assessment (ORora) for the spring 2016 administration. The ORora targets communication (expressive and receptive) and basic skills (attention/joint attention and mathematics) and provides documentation of student progress outside of our clearly defined academic domains.
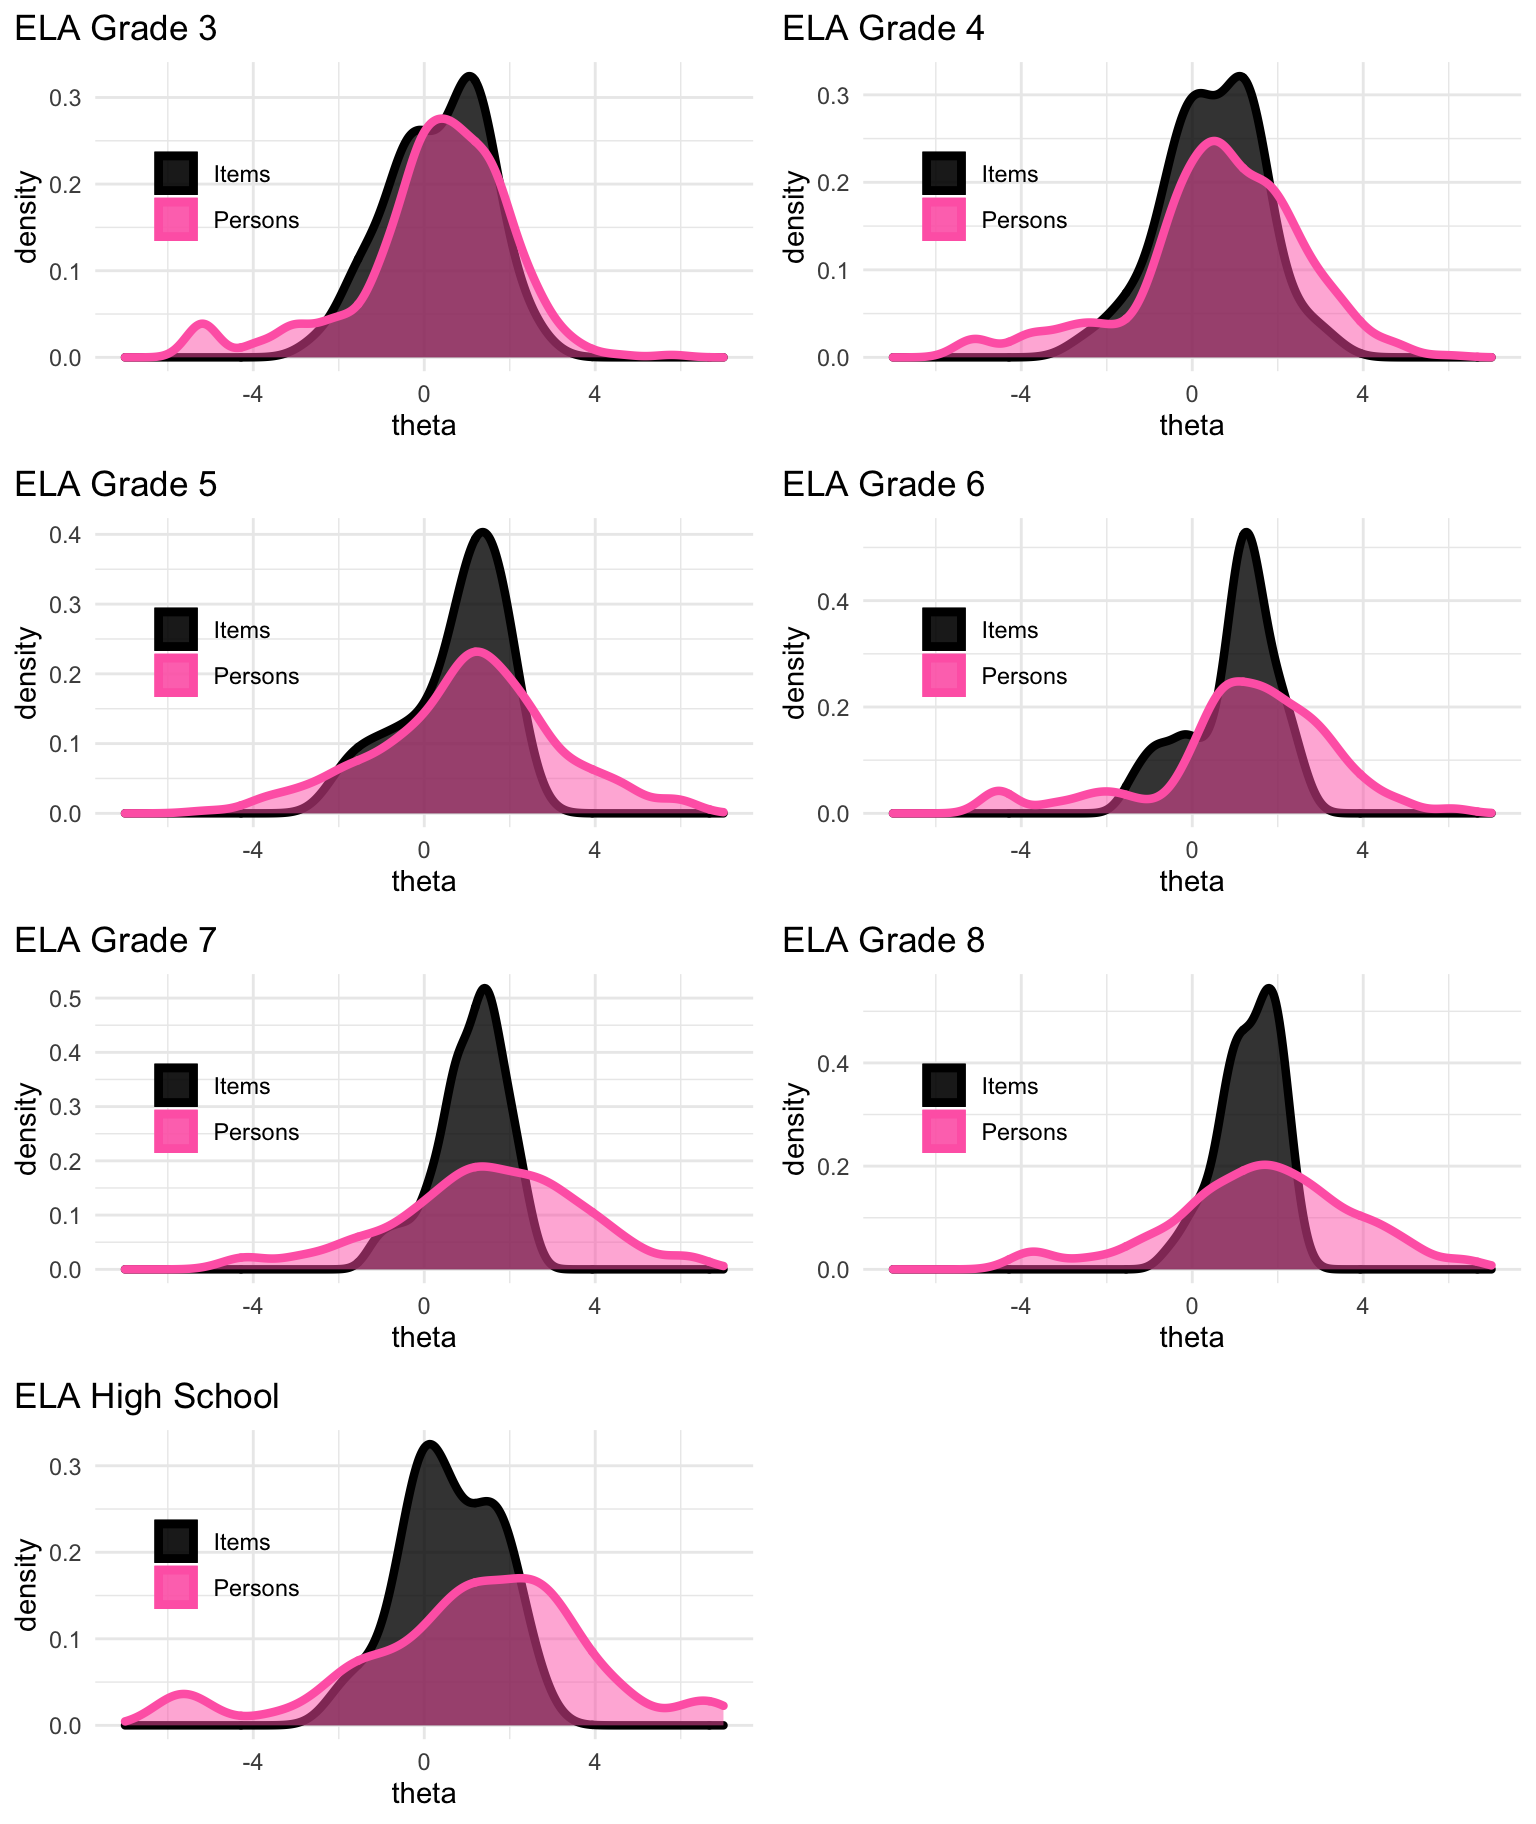
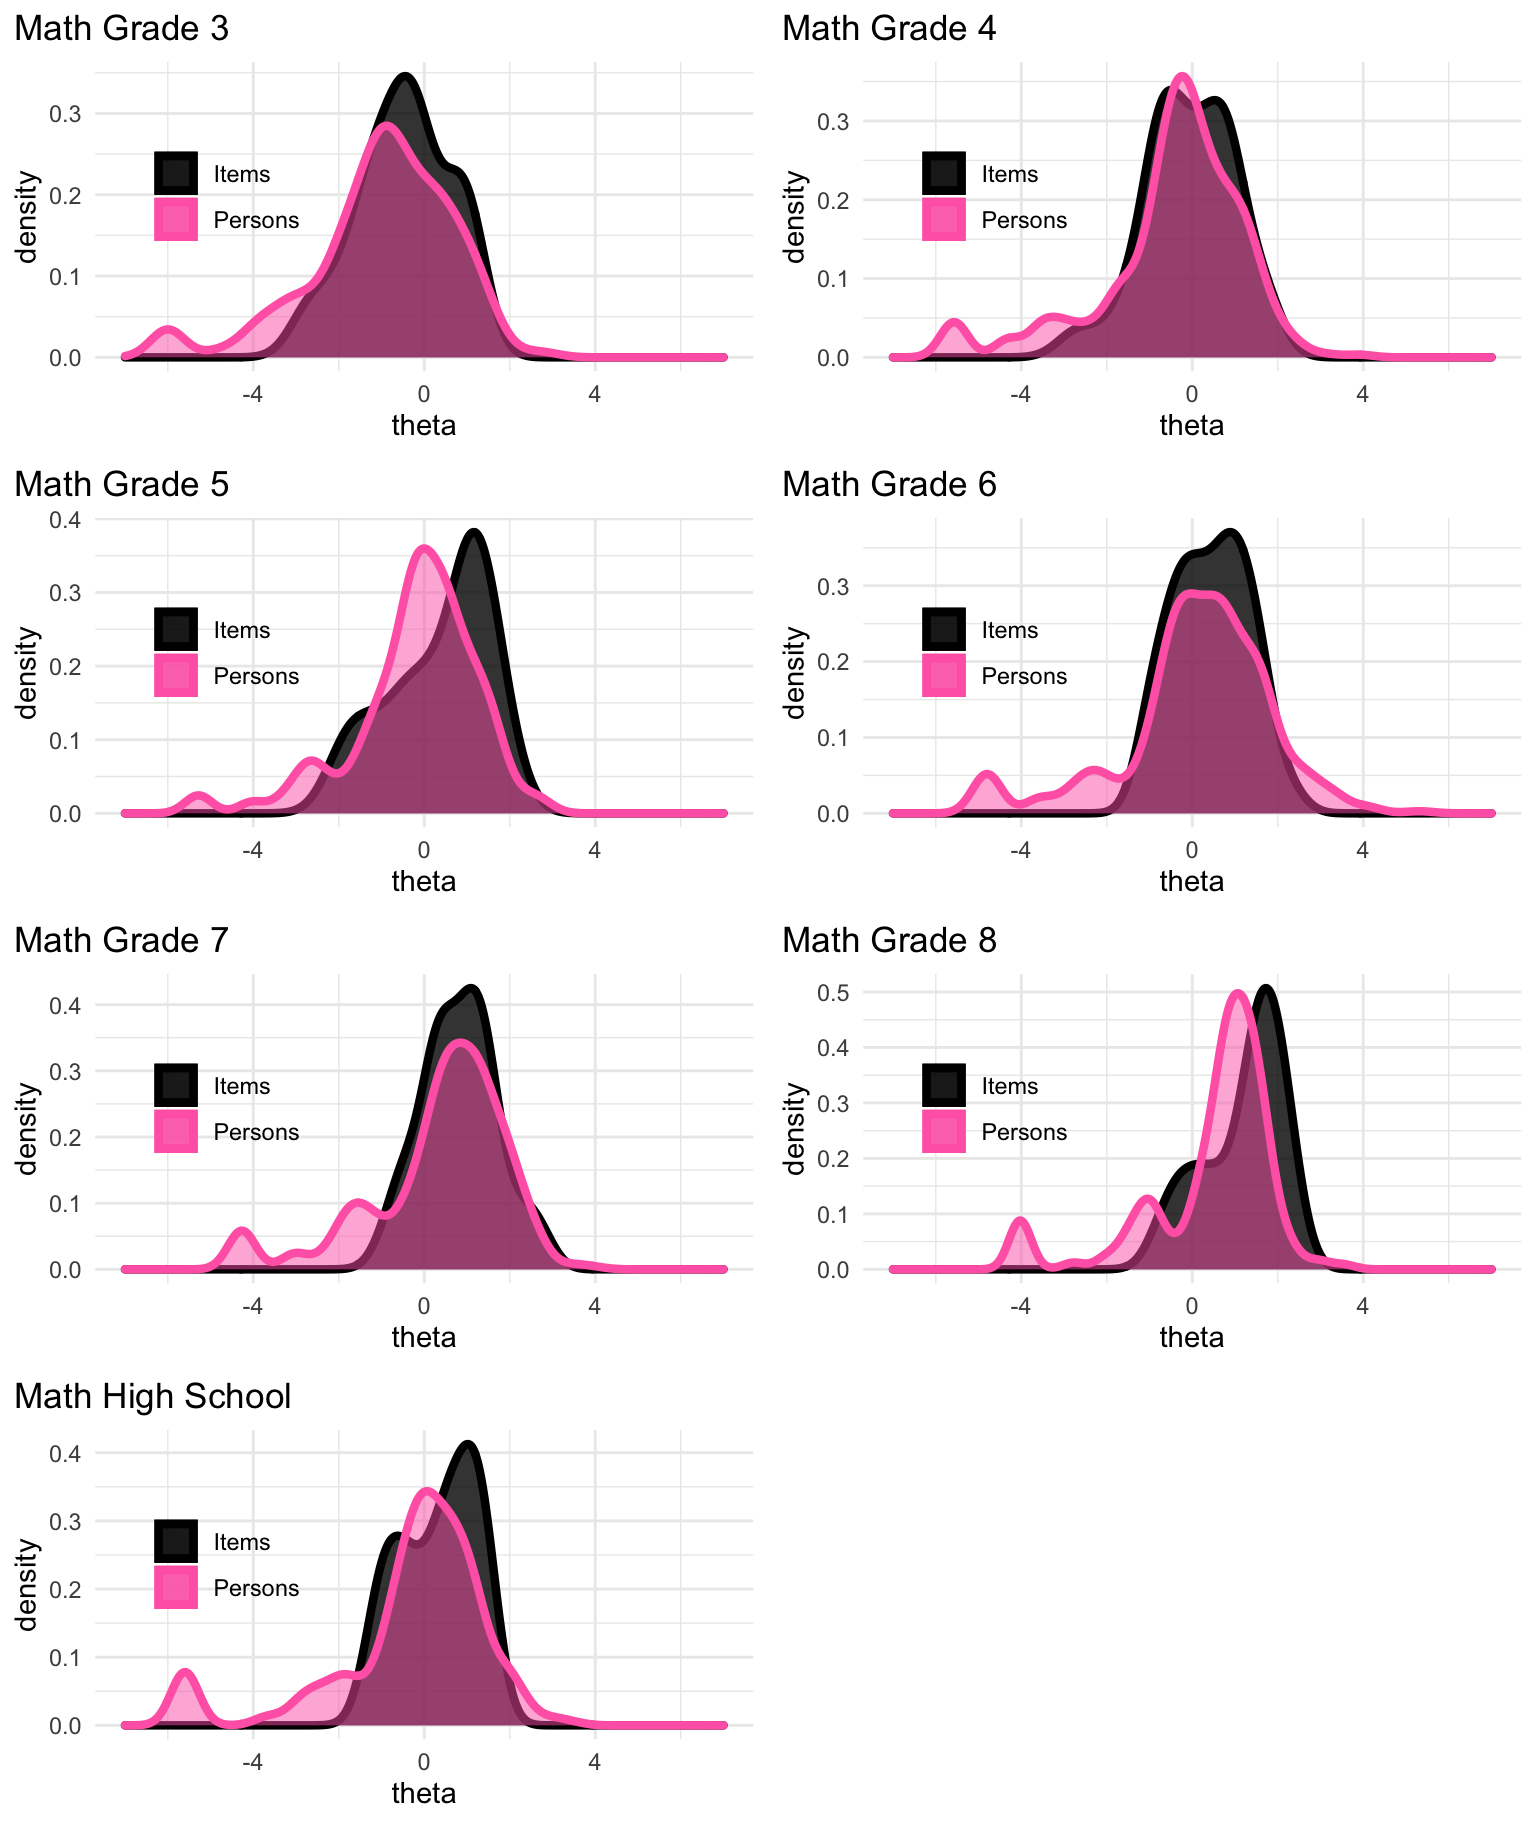
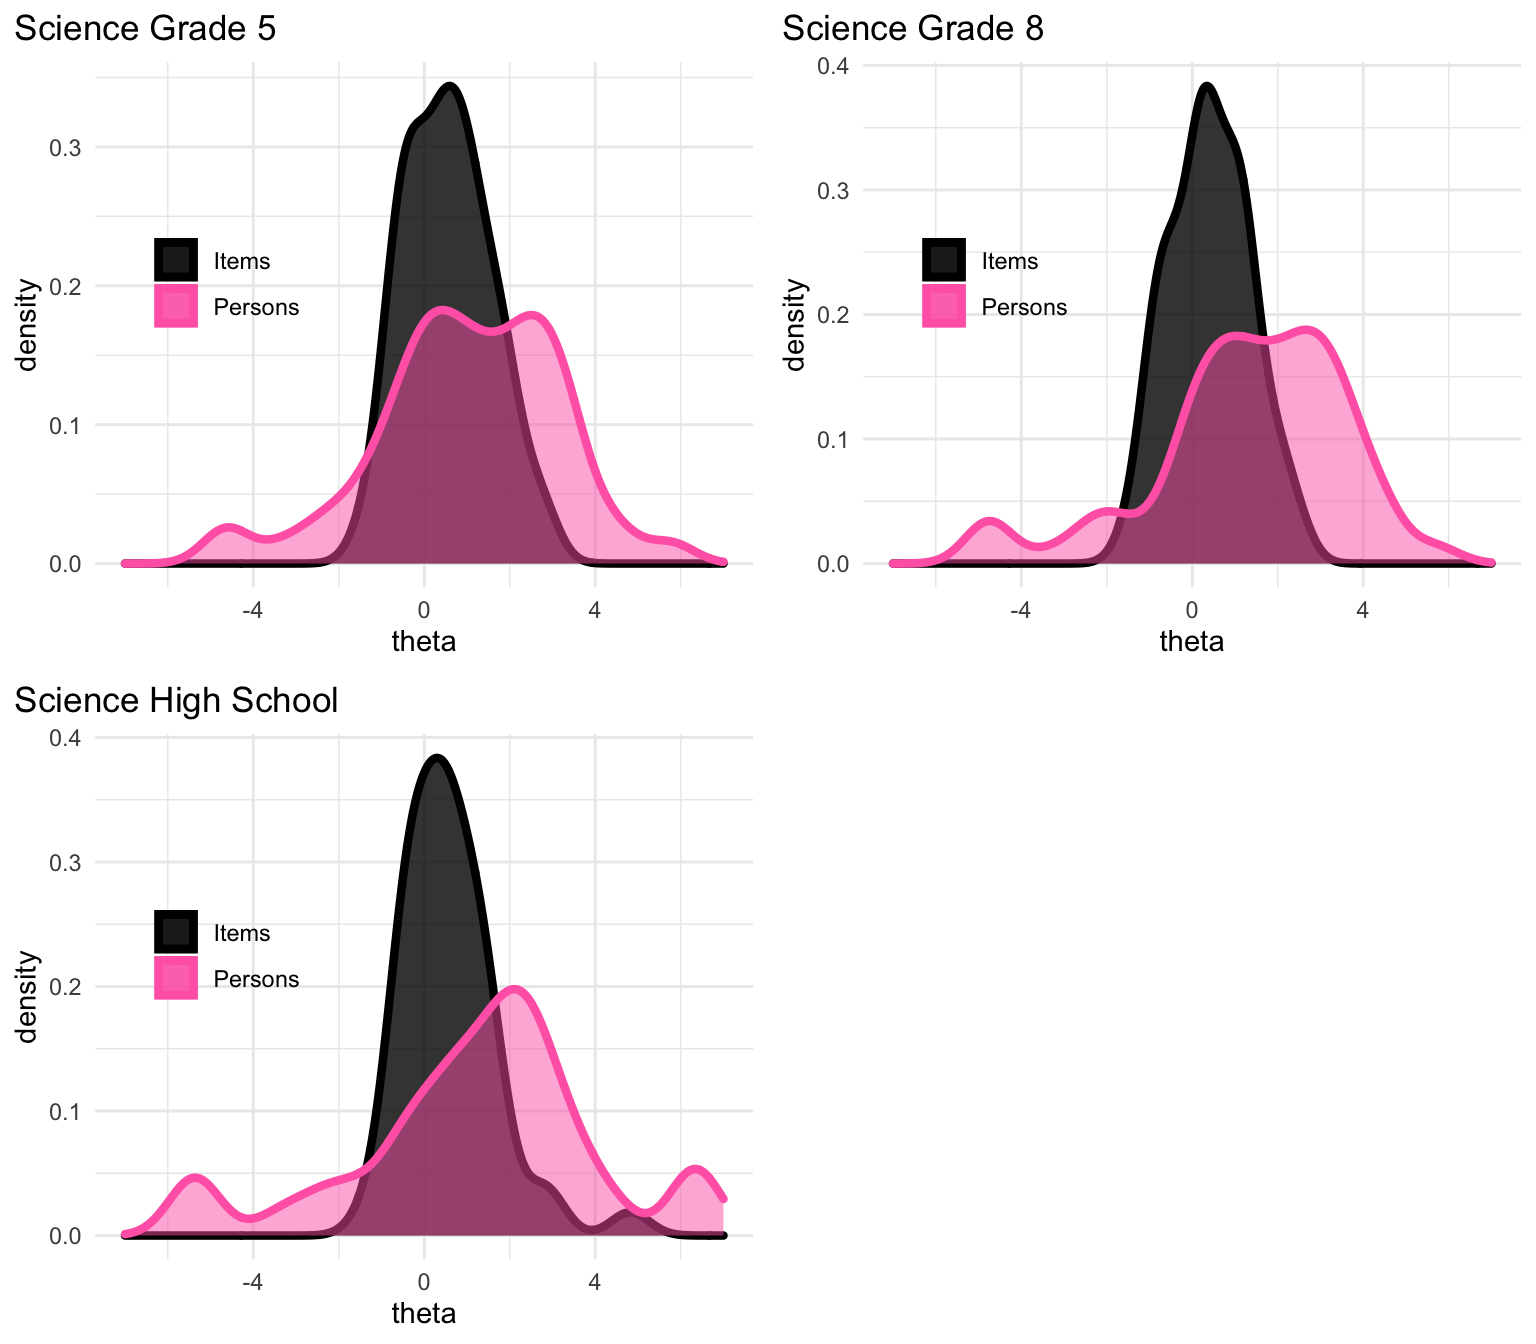
Items on all assessments were scored on a 2-point scale, with 1 point awarded for a correct response and 0 points awarded for an incorrect response. Plots are provided below for each content area and grade level, including the person ability and item difficulty distributions. In general, the descriptive statistics suggest that the test had an appropriate range of item difficulties represented, from easy to difficult, with item difficulties generally ranging from -4.0 to +4.0 on the Rasch scale. The assessments performed as expected across all grades and content areas. The item person distributions provided below demonstrate that the ORExt is providing a performance continuum for students who participate.
4.3A English Language Arts Person/Item Distributions
We see that every test has substantial overalp between the person and item distribution. It is clear, though, that there is over-representation of some areas of the test. From these plots, we can see that ELA tests should focus on covering a wider range of abilities (mostly at the upper end, but really in both directions), rather than overrepresenting moderate difficulty items.
4.3B Mathematics Person/Item Distributions
From these plots, we can see that Math does a very good job of covering the range of abilities represented in the person distribution. Math grade 3 appears to have poor coverage at the upper end of the ability spectrum
4.3C Science Person/Item Distributions
Similar to ELA, science items tend to be overly clustered in the moderate difficulty range. The test could be improved by better covering the range of person abilities, particularly at the upper end of the ability spectrum.
4.4 Scoring
All scoring expectations for the ORExt are established within the Test Administration Training. The scoring procedures for the new ORExt have been simplified, with students receiving a 0 for an incorrect response or a 1 for a correct response. Input from the field gathered from Consequential Validity studies demonstrates that the assessment scoring procedures are much more clear and easier to implement than prior scoring approaches (see Consequential Validity Survey Results). BRT was also commissioned to develop a scaled score interpretation guide, which describes specific strategies for interpreting student test scores and sub-test scores in Reading and Writing, and Achievement Level Descriptors (ALDs) published within the Individual Student Reports 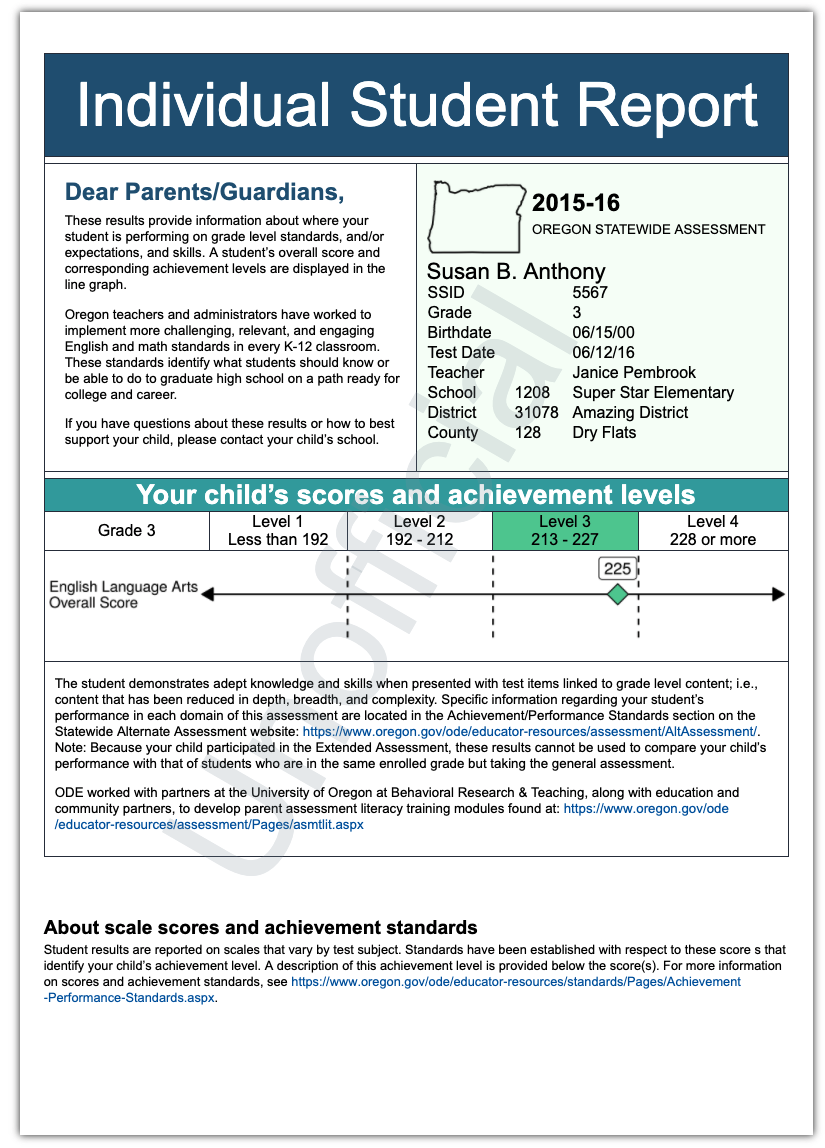 for annual performance, growth, and as part of Essential Skills requirements for very low performing students (see Decision Making Related To Scaled Scores).
4.5 Multiple Assessment Forms
The ORExt was administered in one form per subject area and grade level for the 2021-22 school year, with 36 operational items arranged in order of empirical difficulty and 12 embedded field test items.
4.6 Multiple Versions of An Assessment
The ORExt is provided in the standard format, but is also available in Large Print and Brailled formats. Test content is identical across all three versions, with an occasional item being eliminated on the Braille version due to inaccessibility. These items do not count for or against the student in reporting. Substantive test comparability analyses are not feasible, given the small n-sizes of the samples involved in the alternative versions.
4.7 Technical Analyses and Ongoing Maintenance
The ORExt technical analyses that document reliability and validity are included in this technical report (see Sections 3 and 4, respectively). ODE and BRT staff review these analyses annually. Necessary adjustments to the assessment are determined prior to implementation of the subsequent year’s work plan, which elaborates the areas of improvement as well as aspects of the testing program that will be maintained. This decision-making is supported by input from the field gathered from the Consequential Validity study (see Consequential Validity Survey Results).
Within our system of ongoing improvement is continuation of the development of additional curricular and instructional resources. This addresses an area of concern expressed by stakeholders. Training modules and templates continue to be developed to connect assessment results from the ORExt and ORora with curricular resources and instructional strategies aligned to the standards.